2 Vector data
Vector data represent a GIS data structure in which geometry and position are kept as pairs of coordinates (x, y) or in some cases (x,y,z) or (x,y,t) or (x,y,z,t) and similar. In point data, besides keeping the information on the geometry of each point, usually, attribute data are kept as well. Such data can be presented with a regular data table in which there are positional and attribute data.
| Geometry | Attribute 1 | Attribute 2 | Attribute 3 |
| (x1 y1) | Value 1 | Value 2 | Value 3 |
| (x2 y2) | Value 4 | Value 5 | Value 6 |
In line data, a line is presented by a set of coordinate pairs, connected from point to point by line segments, as they would be connected using a pencil and taking care of their sequence. Polygons are organized similar to lines which begin and end at the same point. The sequence of drawing line segments in polygons is most often defined in a counterclockwise direction for a filled surface, whereas the clockwise direction is used for openings in surfaces, or vice versa, depending on the data format. An example of geometric vector primitives in the Well Known Text format is given in Table 2.2.
| Type | Example of using the Well Known Text syntax | WKT |
| Point |  |
POINT (30 10) |
| Line |  |
LINESTRING (30 10, 10 30, 40 40) |
| Polygon |  |
POLYGON ((30 10, 40 40, 20 40, 10 20, 30 10)) |
| Polygon with opening |  |
POLYGON ((35 10, 45 45, 15 40, 10 20, 35 10), (20 30, 35 35, 30 20, 20 30)) |
Just as for vector data, for raster data there is also a large number of files which were and still are used for keeping spatial data. The history of the development of files and systems was very vividly described by Pebesma et al. (http://r-spatial.org/2016/11/29/openeo.html).
In the 1980s, practically every software developer had their own method of keeping spatial data, Figure 2.1.
)](_media1/image8.png)
Figure 2.1: Organization of spatial data in the 1980s. Every major software developer had their own method of structuring and keeping spatial data; there was practically no interoperability. (http://r-spatial.org/2016/11/29/openeo.htm)
In the 1990s, a change occurred when more software developers started using several file types which made it possible to use the same file in different GIS environments, sometimes with a necessary conversion, but interoperability was possible nonetheless, Figure 2.2.
)](_media1/image9.png)
Figure 2.2: In the 1990s, several file types for keeping spatial data could be used in multiple GIS and CAD environments. (http://r-spatial.org/2016/11/29/openeo.htm)
After that, in 2000, the Geospatial Data Abstraction Layer, GDAL (http://www.gdal.org/) open-source library was made. The GDAL library enabled reading and writing different file types with both vector and raster data structures. Basically, one conversion library was made which enabled the use of different file types in practically all GIS systems, Figure 2.3.
)](_media1/image10.png)
Figure 2.3: GDAL library for manipulating vector and raster data. (http://r-spatial.org/2016/11/29/openeo.htm)
In the following sections, the most popular formats for vector data implemented in the GDAL library will be briefly described.
2.1 Geographic Markup Language (GML) format
GML is an XML “dialect”, growing in popularity as a vector data format. It was created and is developed by the Open Geospatial Consortium (OGC), and is implemented as an open standard. OGC is a nonprofit organization working on standardization in the field of geospatial technologies. The standards created by OGC are freely available (open standards).
GML represents an XML file, hence, it is readable by computer systems, but can also be manipulated by any text editor. GML enables the definition of spatial entities and attributes such as coordinate reference systems, geometry, topology, and time. Generally, spatial and spatio-temporal phenomena can be represented using the GML format.
GML is most often used in Web GIS and cartographic services, as well as in standard GIS software.
What makes GML a powerful format is the fact that, just like similar spatial formats like KML (earlier knows as the Keyhole Markup Language), it can have multimedia content such as text, video, and audio, along with a stylization of the spatial phenomena. Another significant advantage of this format is that it can be easily expanded depending on the user’s needs.
The vector data from Table 2.3 is shown in the QGIS software, with an OpenStreetMaps map as background, Figure 2.4.
| X | Y | id | Name | url |
| 20.47616447 | 44.8056810019 | 1 | Faculty of Civil Engineering | www.grf.rs |

Figure 2.4: Vector data shown in a QGIS environment.
The vector data from Table 2.3 can be created in the GML format using the following syntax:
<?xml version="1.0" encoding="utf-8" ?>
<ogr:FeatureCollection
     xmlns:xsi="http://www.w3.org/2001/XMLSchema-instance"
     xsi:schemaLocation=""
     xmlns:ogr="http://ogr.maptools.org/"
     xmlns:gml="http://www.opengis.net/gml">
  <gml:boundedBy>
    <gml:Box>
      <gml:coord><gml:X>20.47616446997252</gml:X><gml:Y>44.8056810018923</gml:Y></gml:coord>
      <gml:coord><gml:X>20.47616446997252</gml:X><gml:Y>44.8056810018923</gml:Y></gml:coord>
    </gml:Box>
  </gml:boundedBy>

  <gml:featureMember>
    <ogr:test fid="test.0">
      <ogr:geometryProperty><gml:Point srsName="EPSG:4326"><gml:coordinates>20.476164469972524,44.805681001892303</gml:coordinates></gml:Point></ogr:geometryProperty>
      <ogr:id>1</ogr:id>
      <ogr:Name>Faculty of Civil Engineering</ogr:Name>
      <ogr:url>www.grf.rs</ogr:url>
    </ogr:test>
  </gml:featureMember>
</ogr:FeatureCollection>
The first part of the GML file describes the version of the XML document and the character encoding method.
<?xml version="1.0" encoding="utf-8" ?>In GML syntax, just as in XML, all of the content is defined by the elements of the XML file usually called tags. Each tag has a beginning and end. Sometimes, additional attributes can be found within one tag. For example, this file was opened with a tag <ogr:FeatureCollection> with multiple attributes (the part related to the scheme, i.e., the rules used to generate the GML file); it was opened and closed with an appropriate tag of the same name but with a forward slash in front of the tag name </ogr:FeatureCollection>.
<ogr:FeatureCollection>
     xmlns:xsi="http://www.w3.org/2001/XMLSchema-instance"
     xsi:schemaLocation=""
     xmlns:ogr="http://ogr.maptools.org/"
     xmlns:gml="http://www.opengis.net/gml">

...
</ogr:FeatureCollection>
Afterwards comes the part defining the spatial range of the data in which a rectangle was defined with two points, i.e., the southernmost and westernmost point and a point representing the northernmost and easternmost point for the considered dataset. All of this is bordered by appropriate GML file tags.
  <gml:boundedBy>
    <gml:Box>
      <gml:coord><gml:X>20.47616446997252</gml:X><gml:Y>44.8056810018923</gml:Y></gml:coord>
      <gml:coord><gml:X>20.47616446997252</gml:X><gml:Y>44.8056810018923</gml:Y></gml:coord>
    </gml:Box>
  </gml:boundedBy>
After this comes the part describing the geometry and the coordinate reference system in which the coordinates are given, in this case (Table 2.3) it is the World geodetic coordinate reference system WGS84 (EPSG:4326). At the end of the GML file are the contents related to the name and value of the attribute.
<gml:featureMember>
    <ogr:test fid="test.0">
<ogr:geometryProperty>
<gml:Point srsName="EPSG:4326"> <gml:coordinates>20.476164469972524,44.805681001892303</gml:coordinates>
</gml:Point>
</ogr:geometryProperty>
      <ogr:id>1</ogr:id>
      <ogr:Name>Faculty of Civil Engineering</ogr:Name>
      <ogr:url>www.grf.rs</ogr:url>
    </ogr:test>
</gml:featureMember>
2.2 KML format
The KML format was previously owned by Google and developed as a format for geovisualization, i.e., representation of spatial data in 2D and 3D space on a virtual globe Google Earth. Versions 2.2 and newer are implemented as OGC standards.
KML is based on XML with a main focus on spatial visualization, including the possibility of navigating users, both spatially and temporally, so that spatio-temporal visualizations are also possible using the KML format.
If we show the example from the previous section (Table 2.3) using the KML format, it can be seen that the organizational logic of the file is similar to the GML format, only the tag notation is based on the KML scheme.
<?xml version="1.0" encoding="utf-8" ?>
<kml xmlns="http://www.opengis.net/kml/2.2">
<Document id="root_doc">
<Folder><name>test</name>
  <Placemark>
<Point> <coordinates>20.476164469972524,44.805681001892303</coordinates> </Point>
  </Placemark>
</Folder>
</Document>
</kml>
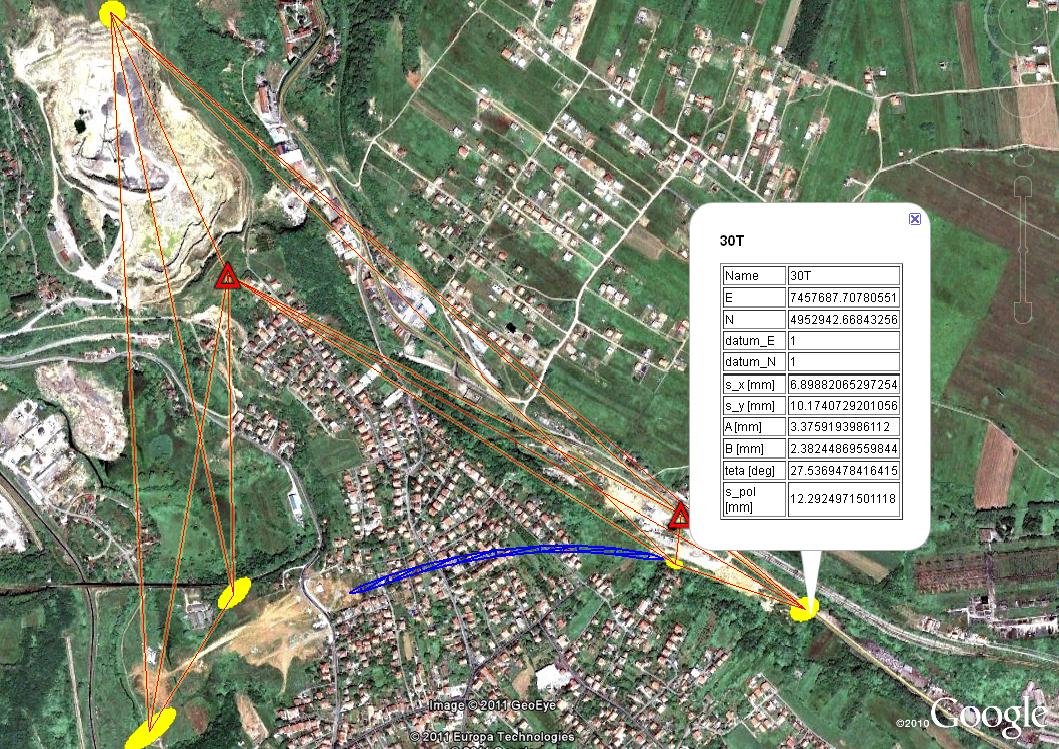
The compressed KML files has a KMZ extension. Similar to the GML file, besides the stylization which can be saved in a KML format, multimedia content can also be integrated, Figure 2.5. Using the KML format, it is possible to define the way in which attribute data will be displayed: adding urls, defining font size, text style, color, or alignment, tables, etc., Figure 2.6.

Figure 2.5: Display of a geodetic network on a Google Earth virtual globe with connected attribute data formatted in a table.
).](_media1/image13.jpeg)
Figure 2.6: Display of a visualization in KML format with multimedia content, formed using the R package plotKML).
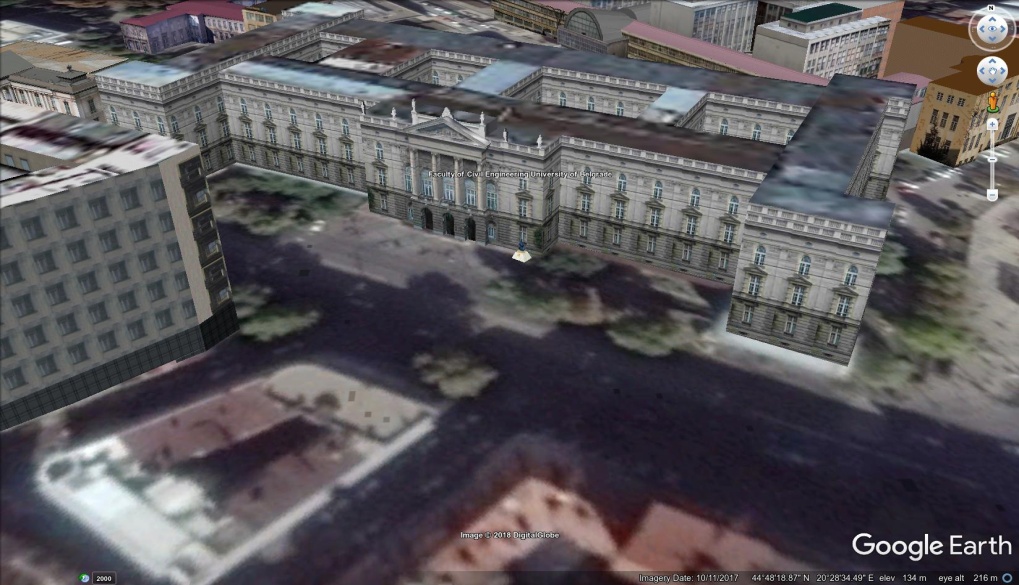
Besides displaying and visualizing spatial and spatio-temporal phenomena, and trajectories, 3D objects can also be generated and visualized in KML format and they can be connected with textures in the format of photographs (Figure 2.7). For generating KML files the SketchUp software is often used.

Figure 2.7: Display of the building of the Faculty of Civil Engineering Belgrade in a 3D environment on a Google Earth virtual globe.
2.3 CityGML format
CityGML is also an OGC format open standard based on XML, primarily intended for storing and exchanging virtual 3D models of cities. It was created on the basis of the GML3 specification for rendering 3D objects. CityGML, unlike KML, has a clearly and hierarchically organized geometry together with semantics for all its elements.
The entities that can be modeled are:
Digital terrain models,
Built structures (building),
Vegetation,
Bodies of water,
Road networks,
Urban furniture (lampposts, traffic signs, etc.)
Characteristically, this format is organized into 5 Levels of Detail (LOD):
LOD 0 - regional level, landscape;
LOD 1 - city, region;
LOD 2 - city quarter;
LOD 3 – detailed model of an objects exterior
LOD 4 – model of an object with interior details
A display of the app providing information on the solar potential of roofs in Inđija, based on the CityGML model, is given in Figure 2.8.
 app, display of the solar potential of roofs on a virtual globe [NASA World Wind](https://worldwind.arc.nasa.gov/)](_media1/image15.jpeg)
Figure 2.8: Visualization of a semantic CityGML LOD2 model, example of the i-Scope app, display of the solar potential of roofs on a virtual globe NASA World Wind
Another example of using CityGML data is the render of a 3D model of New York on a virtual globe Cesiumjs, Figure 2.9.
.](_media1/image16.png)
Figure 2.9: Display of a 3D model of New York where buildings have different colors according to their height. For an interactive view, visit https://cesiumjs.org/NewYork/.
2.4 GeoJSON format
GeoJSON is a standard open format for representing vector spatial data, which uses JavaScript object notation. It is mostly used in web cartographic clients such as OpenLayers and Leaflet. Similar to other vector formats, GeoJSON supports basic geometric primitives: points, lines, and polygons. Additionally, groups containing multiple points, lines, or polygons can be treated as single entities with labels MultiPoint, MultiLineString, and MultiPolygon, respectively. If we want to show a country with all its islands, e.g., Greece, in one object, then we would use a MultiPolygon geometric primitive, Table 2.4.
| Type | Example |
Multiple points  |
{ "type": "MultiPoint", "coordinates": [ [10, 40], [40, 30], [20, 20], [30, 10] ] } |
Multiple lines  |
{ "type": "MultiLineString", "coordinates": [ [[10, 10], [20, 20], [10, 40]], [[40, 40], [30, 30], [40, 20], [30, 10]] ] } |
Multiple polygons  |
{ "type": "MultiPolygon", "coordinates": [ [ [[30, 20], [45, 40], [10, 40], [30, 20]] ], [ [[15, 5], [40, 10], [10, 20], [5, 10], [15, 5]] ] ] } |
Multiple polygons  |
{ "type": "MultiPolygon", "coordinates": [ [ [[40, 40], [20, 45], [45, 30], [40, 40]] ], [ [[20, 35], [10, 30], [10, 10], [30, 5], [45, 20], [20, 35]], [[30, 20], [20, 15], [20, 25], [30, 20]] ] ] } |
The following example will show a vector object with the location of the Faculty of Civil Engineering and three connected attributes used in the KML and GML formats for demonstrating the data structure. In this case, the vector data is structured as a JavaScript object. It also contains the data on the coordinate reference system (crs), attributes (properties), and the entity’s geometry (geometry).
{
"type": "FeatureCollection",
"crs": { "type": "name", "properties": { "name": "urn:ogc:def:crs:OGC:1.3:CRS84" } },

"features": [
{ "type": "Feature", "properties": { "id": 1, "Name": "Faculty of Civil Engineering", "url": "www.grf.rs" },
"geometry": { "type": "Point", "coordinates": [ 20.476164469972524, 44.805681001892303 ] } }
]
}
The app in which it is possible to create GeoJSON files and analyze their structure is available at geojson.io.
An add-on to GeoJSON is the TopoJSON extension which codes spatial topology and typically enables smaller file sizes. With TopoJSON files,data are not stored multiple times, e.g., a border between two municipalities would saved only once.
2.5 Well Known Text (WKT)
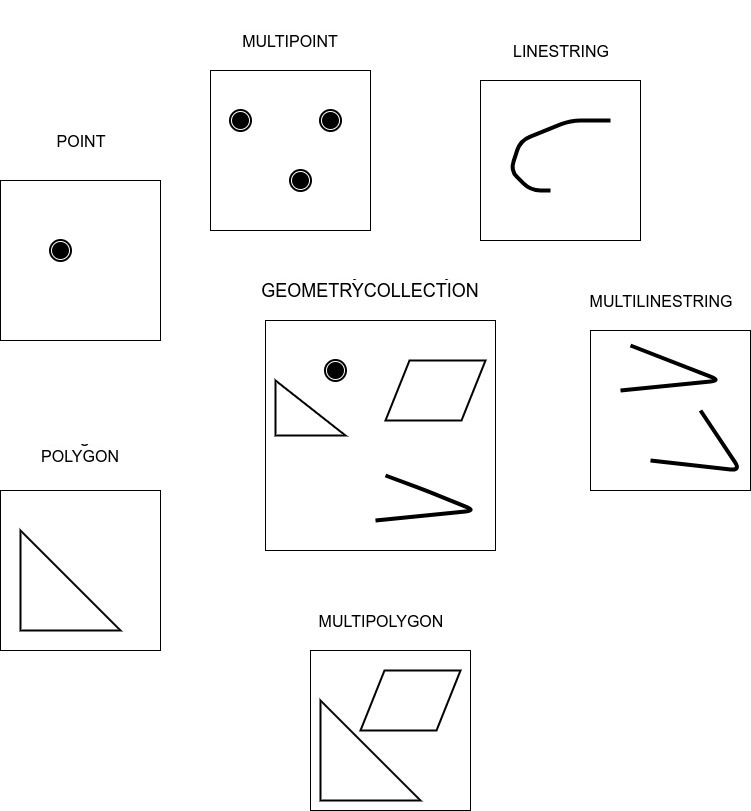
Well Known Text - WKT is a markup language for the representation of spatial vector data which is often used in spatial databases and is thus very suitable for displaying data in a tabular form. In Table 2.5, the example which was previously used for the already described formats is given. WKT supports basic geometric primitives: points, lines, polygons, multiple points (as a single entity), multiple lines (as a single entity), multiple polygons (as a single entity), and geometric collections (as a single entity).
| WKT | id | Name | url |
| POINT (20.4761644699725 44.8056810018923) | 1 | Faculty of Civil Engineering | www.grf.rs |
Generally, multiple geometric primitives are illustrated in Figure 2.10.

Figure 2.10: Geometric primitives supported by WKT.
2.6 ESRI Shapefile format
ESRI Shapefile is a popular format for storing vector data developed by the ESRI company in the 1990s and later used by numerous GIS software. Unlike previous formats, ESRI Shapefile is a binary format; hence, it cannot be viewed and modified in text editors. It is usual to form at least three files under the same name for each vector layer:
test.shp — geometric primitives,
test.shx — indexed entities related to geometry,
test.dbf — attribute data in dBase IV format.
For example, there can be an additional test.prj file related to the projection, or several other files.
More details about the ESRI Shapefile format can be found at http://downloads.esri.com/support/whitepapers/mo_/shapefile.pdf.
Beside this, there are many other formats used to manipulate vector spatial data. A table of formats available for manipulating GDAL libraries is available at http://www.gdal.org/ogr_formats.html.
Using the ogr2ogr GDAL library function, transformations from one format to another are easily performed.
An example of command line conversion from Shapefile to GeoJSON format is given below:
ogr2ogr -f "GeoJSON" output.json input.shpThe -f command is an argument of the ogr2ogr function for determining the format of the output file. In GDAL functions, the principle is that arguments are given with a hyphen (-) in front of the argument name, followed by a space and then the argument value. The input.shp file is the input data in ESRI Shapefile format, whereas output.json is the conversion result in GeoJSON format. A detailed description of the function and its arguments can be found at http://www.gdal.org/ogr2ogr.html or by calling the function manual from the command line:
ogr2ogr --long-usage In order to execute these commands in the command line, it is necessary to first install the GDAL library. The installation differs depending on the operating system.
These conversions can be easily performed using QGIS, SAGA-GIS, or a similar desktop GIS software because GDAL is a basic component of numerous GIS software. In the QGIS environment, conversion is possible when the mouse right-click is performed on the vector layer and the Save As option is selected; a number of target formats can be chosen from the drop-down menu which appears. The SAGA-GIS environment is similar: the Import-Export functionality set is chosen and using the GDAL/ORG function it is possible to perform conversions between different formats.
2.7 Available sources of vector data
In this section, several sources available for downloading free vector data (open data), will be briefly mentioned.
The Open Data Institute defines open data as:
data that are easily shared via the Internet,
data that are available in a standard format,
data that have guaranteed access and consistency over time,
data that have a clear description of how they were generated.
Natural Earth - A portal for downloading free vector and raster data of different levels of detail and precision. Available at http://www.naturalearthdata.com.
Esri Open Data - In 2017, the Esri company created a geoportal for downloading a large number of both vector and raster datasets in standard GIS formats. Available at https://hub.arcgis.com/pages/open-data.
OpenStreetMap (OSM) - This is the largest volunteer database and web portal for spatial data, similar to portals such as Google Maps or Bing Maps, with the difference that data are available for download in a format secured by the OpenStreetMap organization. For conversion into standard formats, one of several QGIS plugins for downloading OSM data ca be used. Available at https://www.openstreetmap.org/.
GADM - This is a database on administrative borders, organized into seveal hierarchical levels and available in standard GIS formats. Available at http://gadm.org/.
GeoNames - This is a database of geographic names, toponyms, with locations of the names and additional attributes. Data can be downloaded as text but can be easily converted into one of several GIS vector formats. Available at http://www.geonames.org.
On the following address, https://freegisdata.rtwilson.com/, a list containing a large number of sources of vector and raster data can be found, grouped by categories.