11 Generalization in cartography
In order to understand cartographic generalization, the following three questions should be considered (Shea and McMaster 1989):
1) Why do we generalize?
Cartographic generalization is performed in order to achieve the necessary map readability when converting from a larger to a smaller scale.
Maps cannot represent everything existing in reality – maps are by their nature selective. Also, objects and phenomena cannot be represented on maps identical to their appearance in reality. A consequence of this is that generalization is used on all maps, it is unavoidable.
Generalization improves the map’s ability to communicate, i.e., its ability to convey information. In doing this, the main goal is to preserve geographic patterns and emphasize thematic information.
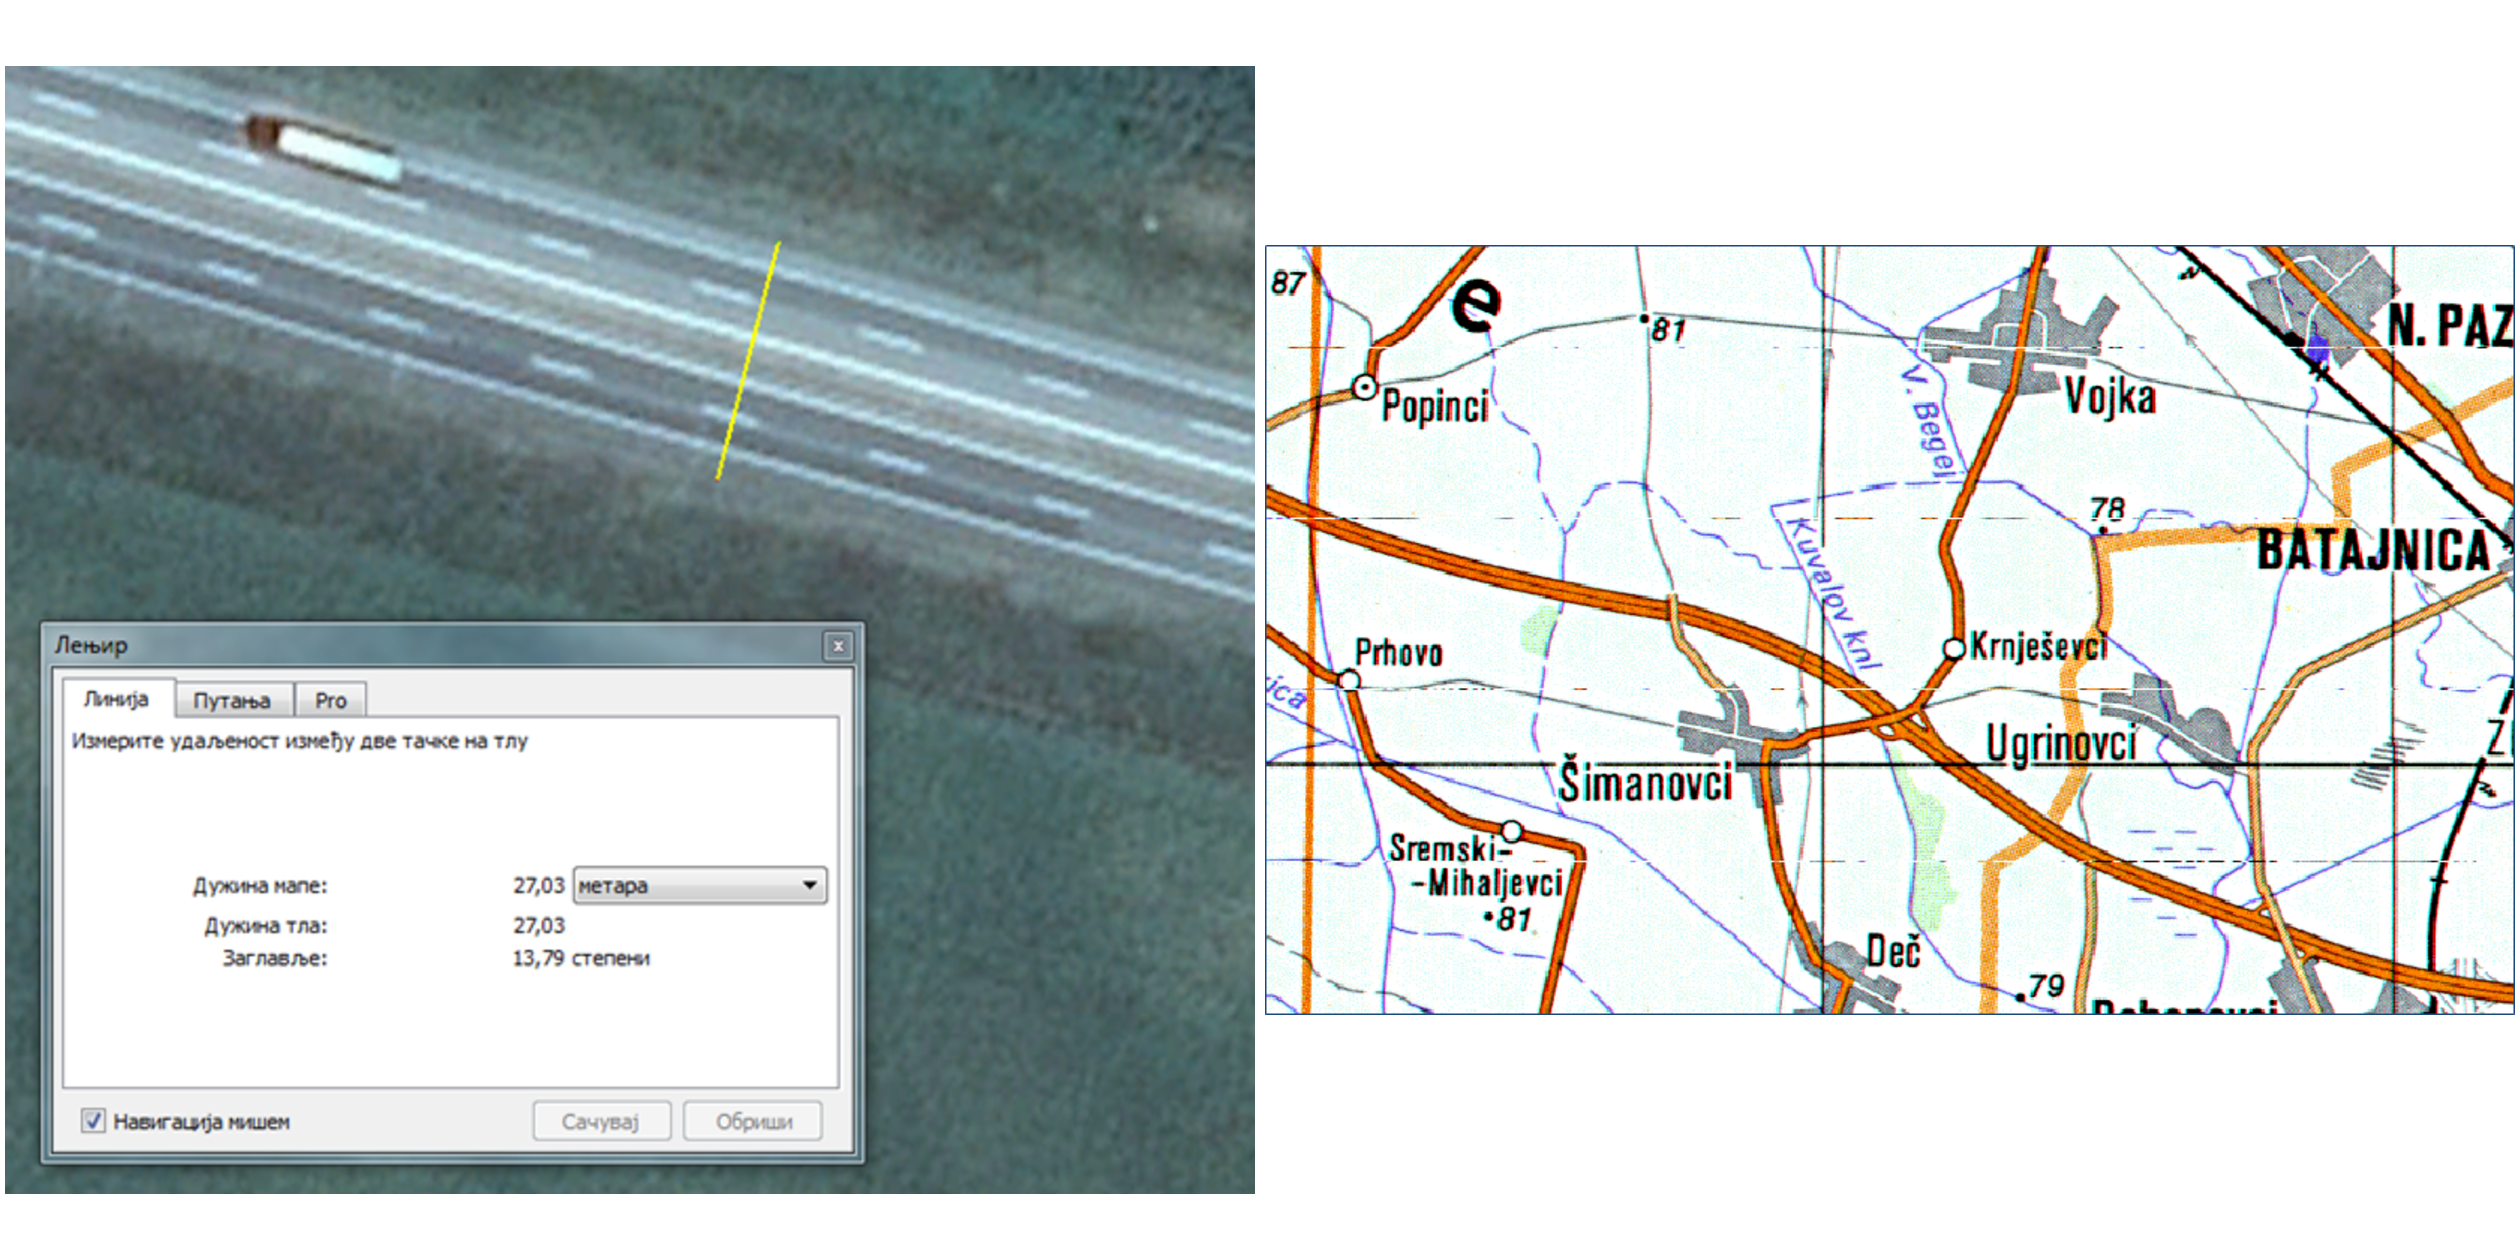
Due to unavoidable generalization in cartography, the terms precision (positional and thematic) and thruthfulness are given new meaning. Precision becomes relative, and thruthfulness comes to mean displaying the essence of spatial patterns and interrelations between spatial phenomena (Figure 11.1).

Figure 11.1: The highway is 27 m wide in reality. On a map with a 1:300.000 scale, it is represented by a 1 mm thick line which would be 300 m wide in reality.
2) When do we generalize?
In order to answer this question, three elements that affect generalization should be taken into account: conditions, measures, and controls. Conditions under which a need for generalization arises include a high density of content, possible coalescence of objects due to scaling, conflict, complexity, inconsistency, and perception inability. Seven measures are defined based on which a decision on generalization is made: object density, object distribution, length of linear elements (singular lines and surface object boundaries), shape, distance, gestalt, and abstract measures (homogeinity, symmetry, repetition, etc.). In order to ensure unbiased generalization, control measures are necessary: generalization operator control, generalization algorithm choice, and generalization parameter definition.
3) How do we generalize?
In order to carry out a generalization, we use generalization operators or methods. Basic categories of generalization methods are the following:
Selection – Selection is a choice of objects and phenomena to be displayed on a map. In this the following choices are made:
- OBJECT CATEGORY to be shown
Example: cities, river networks, roads, and terrain will be shown
- AMOUNT OF INFORMATION within chosen categories
Example: islands which are smaller than 2 mm2 on the map will not be shown
Example: lakes which are smaller than 2 mm2 on the map will not be shown
Example: in dense road networks, lower category roads will not be shown
Simplification – Complex objects and phenomena cannot be displayed in full detail -> the level of detail is reduced.
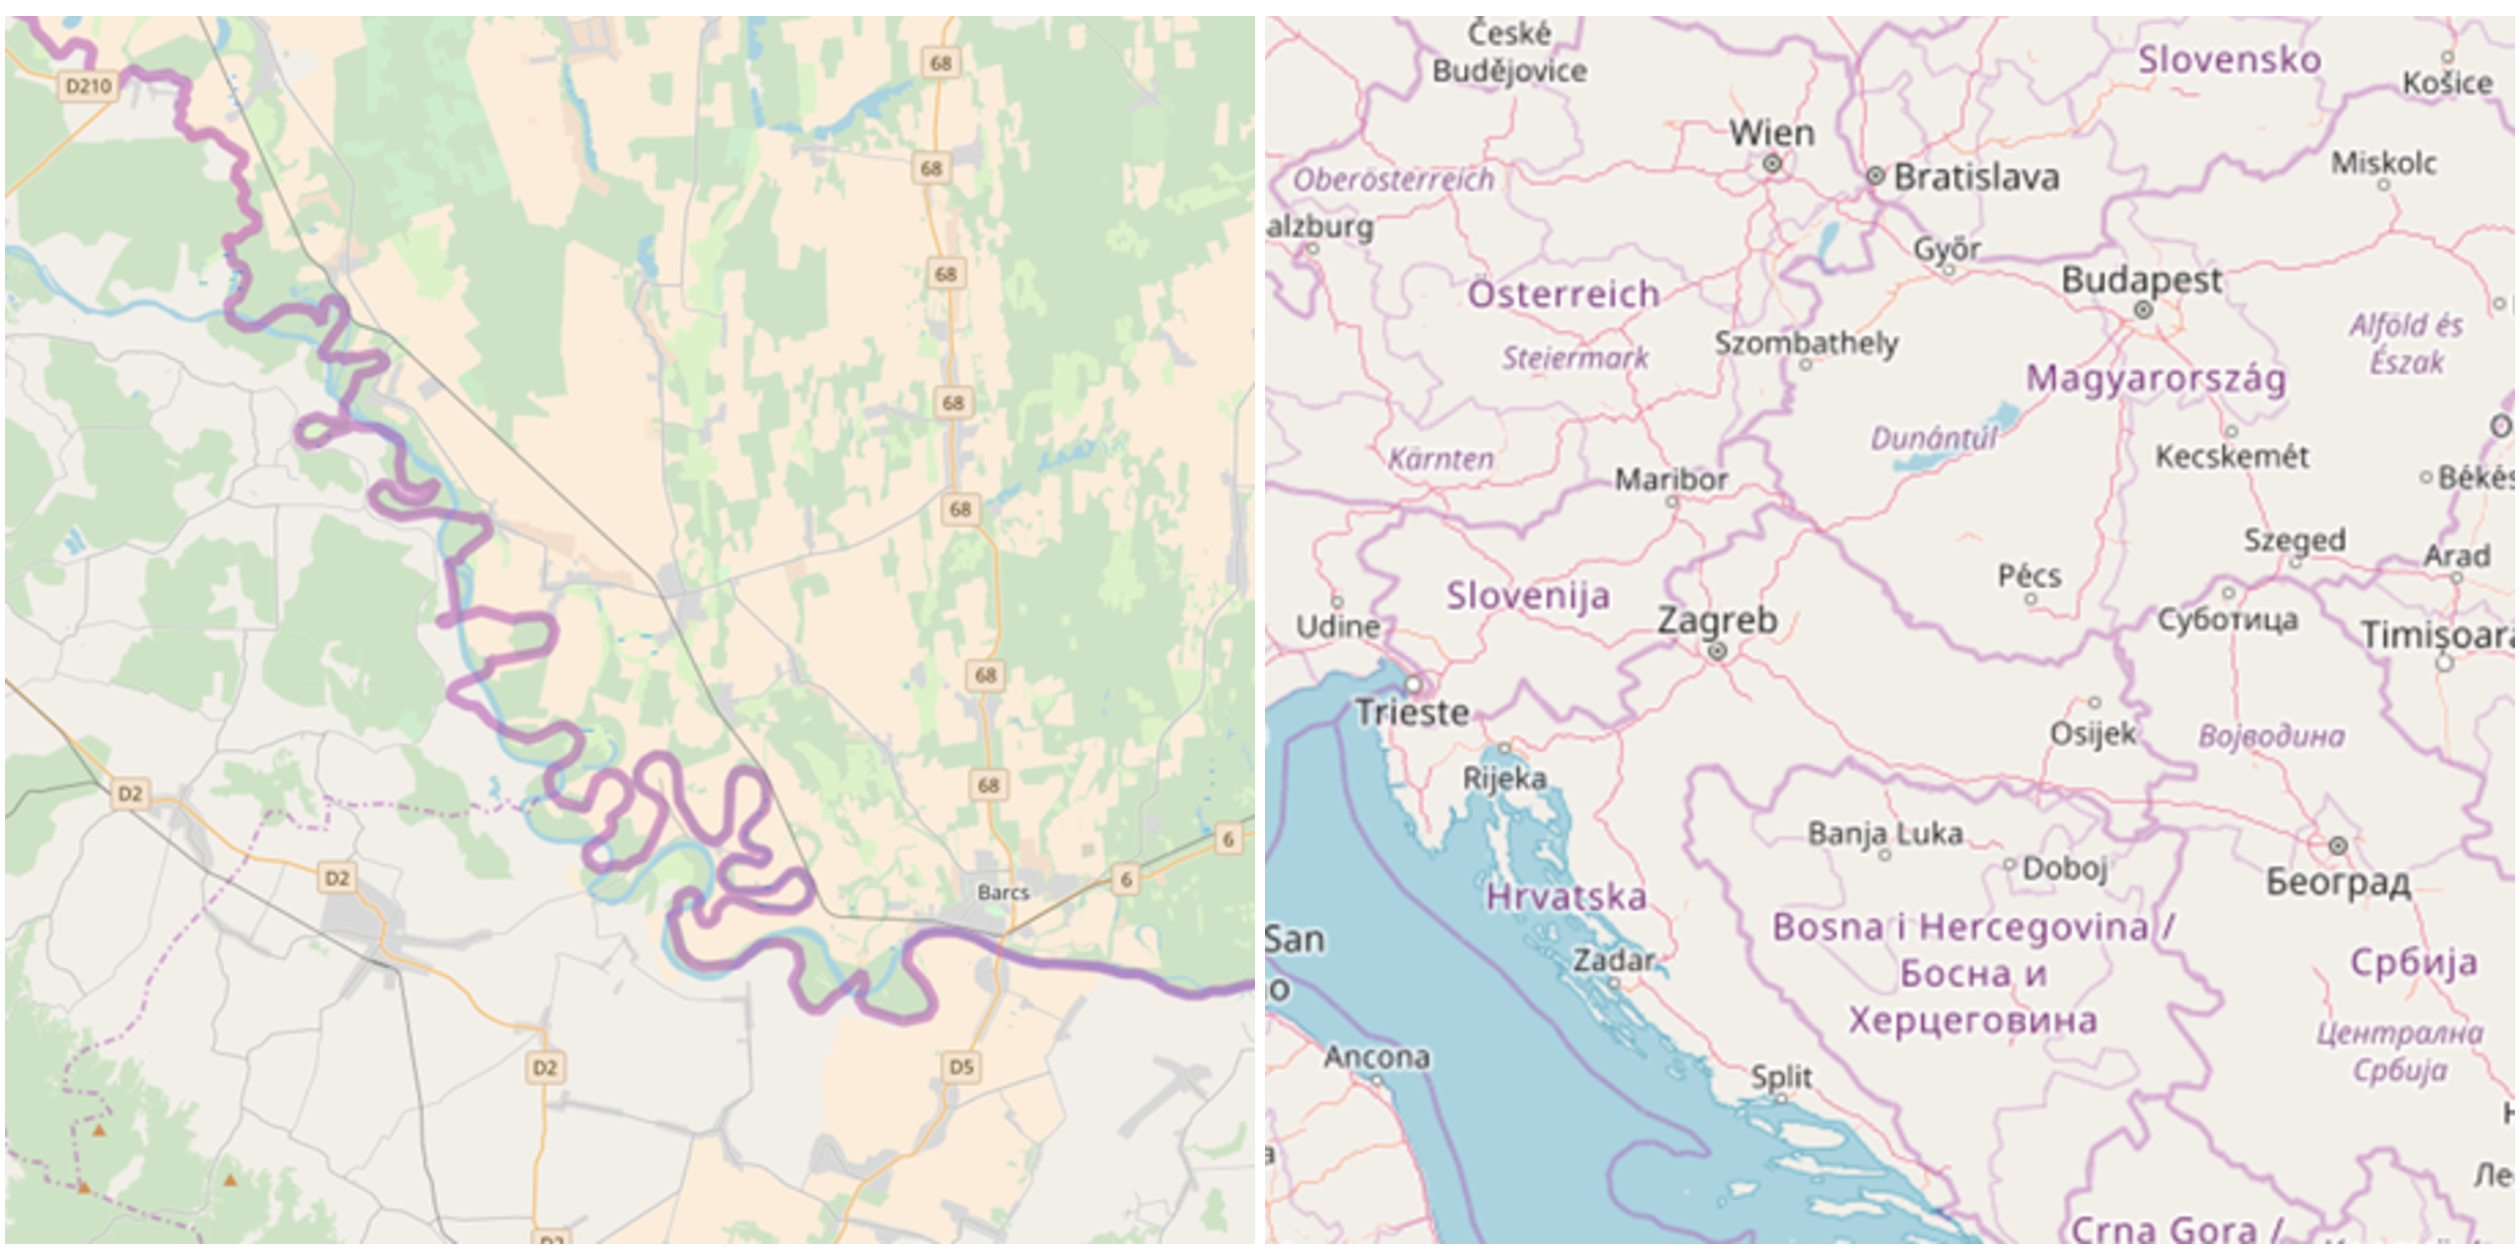
A simplification means straightening lines of curvilinear objects or boundaries of surface objects. Typically, a limit curvature value is set (e.g., 0.5 mm on a map).

Figure 11.2: Example of simplification – complex border between Croatia and Hungary (Source: OpenStreetMap).
The level of simplification of an object depends on the scale and on the objects importance on the map.
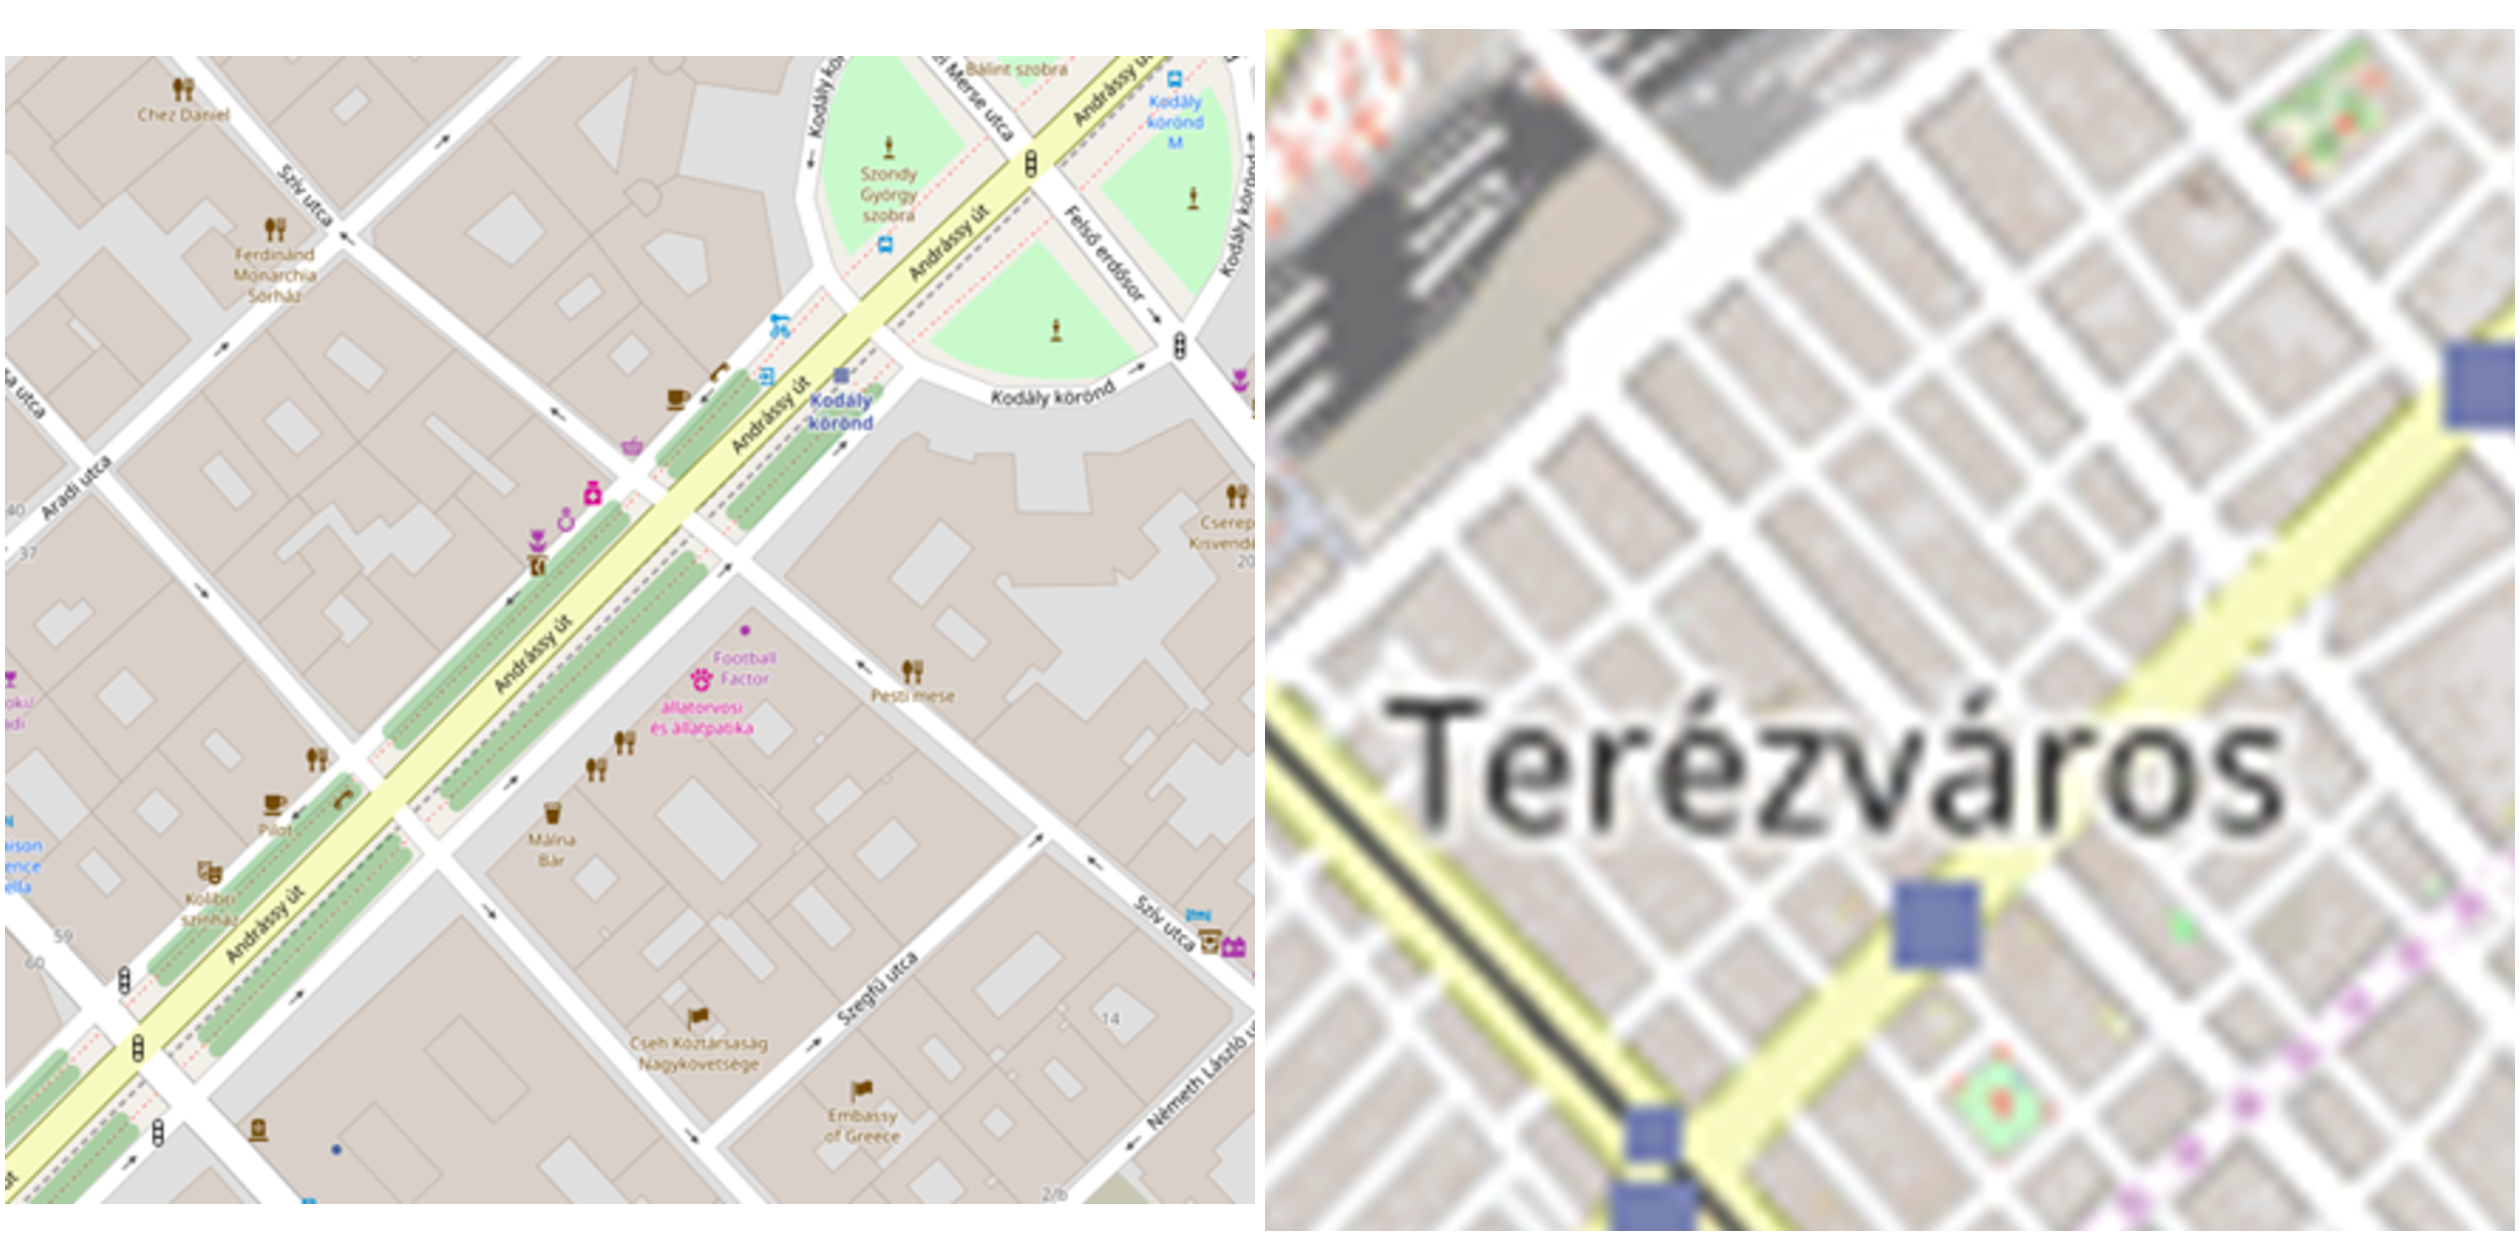
Grouping – Small objects/phenomena are grouped into larger ones (e.g., trees into a forest, buildings into blocks)
Note: multiple small lakes or islands are not grouped together.

Figure 11.3: Example of grouping building into blocks (Source: OpenStreetMap).
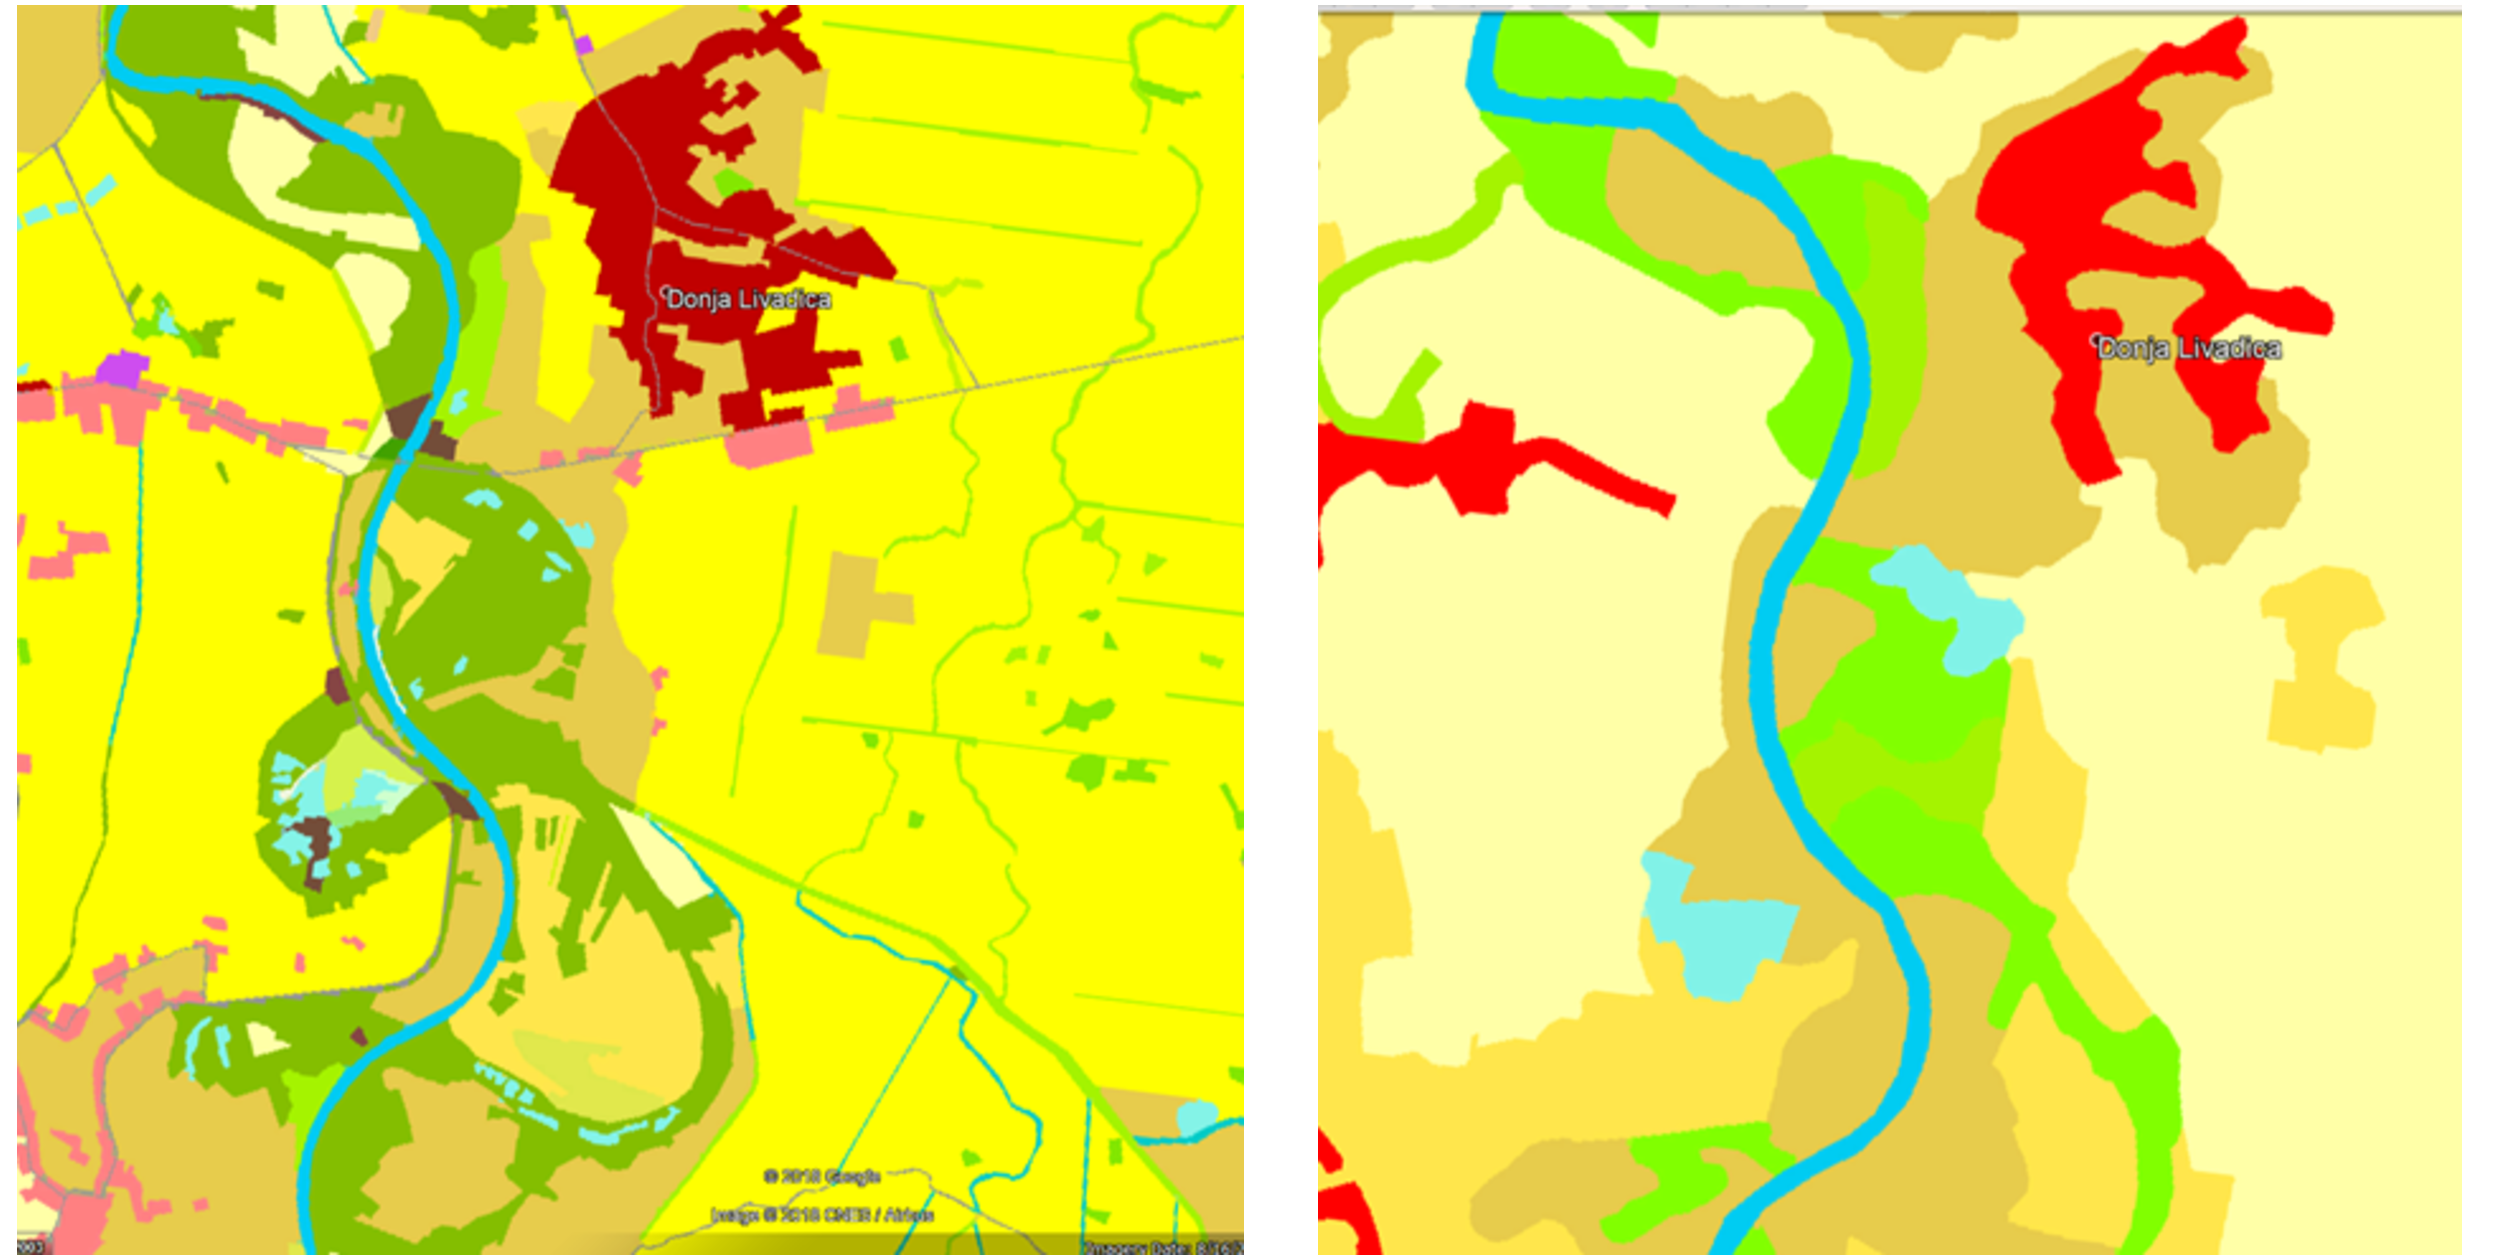
Furthermore, it is possible to group different categories into one (e.g., fields and pastures into agricultural land).

Figure 11.4: Example of grouping classes of soil layers: CLC classes at level 4 (left) and CLC classes at level 3 (right) (Source: Copernicus land monitoring service - https://land.copernicus.eu).
Classification – Objects and phenomena are classified into classes with certain limits – this leads to a loss of quantitative and qualitative properties of these objects or phenomena (e.g., all cities with 50.000 to 100.000 inhabitants are a single class displayed using a single sign).
Classification achieves an easier perception and mental processing of information.

Figure 11.5: Classification of cities.
Exaggeration – Objects or phenomena are exaggerated in order to be visible on a map with a certain scale
Examples:
in small scale maps, roads are much wider than in reality;
if a road and railway pass through a narrow valley, the valley can be stretched in order to fit everything;
small, remote island, important for navigation, are enlarged in order to be visible
Movement – An object can be minimally moved in case of high density of information on a map, in order to fit everything
Example: when several neighboring roads and railways stretch in paralle, they can be separated minimally, in order to make each of them visible
Choice of cartographic signs – Different cartographic signs offer different levels of information about an object
Example: a city can be represented using a surface geometric sign representing the area of the city, or using a symbol (e.g., a circle).
References
Shea, K Stuart, and Robert B McMaster. 1989. “Cartographic Generalization in a Digital Environment: When and How to Generalize.” In Proceedings Auto-Carto, 9:56–67.