8 Maps and cartography
8.1 Definitions and uses of maps (What are maps and what are they used for)
It is important to begin this chapter, which deals with the principles of cartographic expression, with a consideration of what maps are and what are they used for. A definition of a map provides the necessary foundation for deconstructing the concept of a map into elements which can be managed. Although there are numerous map definitions formulated by different authors, three of them will be presented here which will most adequately serve the needs of this text.
Definition 1: A map is a graphical representation of cultural and physical space. The key word here is graphical representation since all maps are visual representations of phenomena being modeled1.
Definition 2: A map is a reductionist, selective, and symbolic graphical representation of a space2. This definition introduces three key terms: reductionist, selective, and symbolic. The first term, reductionist, is related to the fact that almost all maps are more useful when produced in scales smaller than the modeled phenomenon. The second term, selective, means that maps should only include phenomena tied to the map’s message. The third term, symbolic, relates to the idea that phenomena on a map are represented using cartographic signs and symbols.
Definition 3: A map is a perfect interface between geoinformation and its users3 (Georg Gärtner, former president of the ICA). In other words, by looking at a map, people are capable of obsering a certain space and its aspects.
It is completely clear that, as in the case of written text, maps relay a certain message. Their purpose is to answer their users’ questions, such as Where…?, What…?, How much…?, Which…?, When…? (Figures 8.1,8.2, 8.3, 8.4, 8.5)
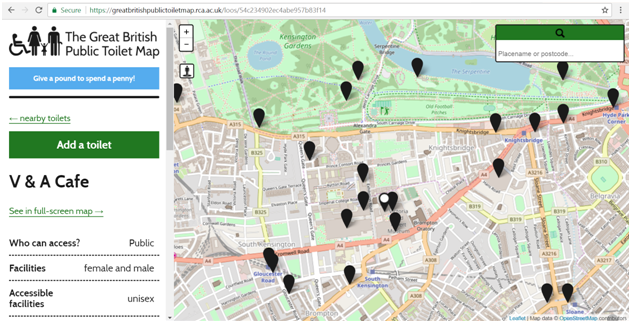
Figure 8.1: WHERE….are public toilets located in London? (https://greatbritishpublictoiletmap.rca.ac.uk)
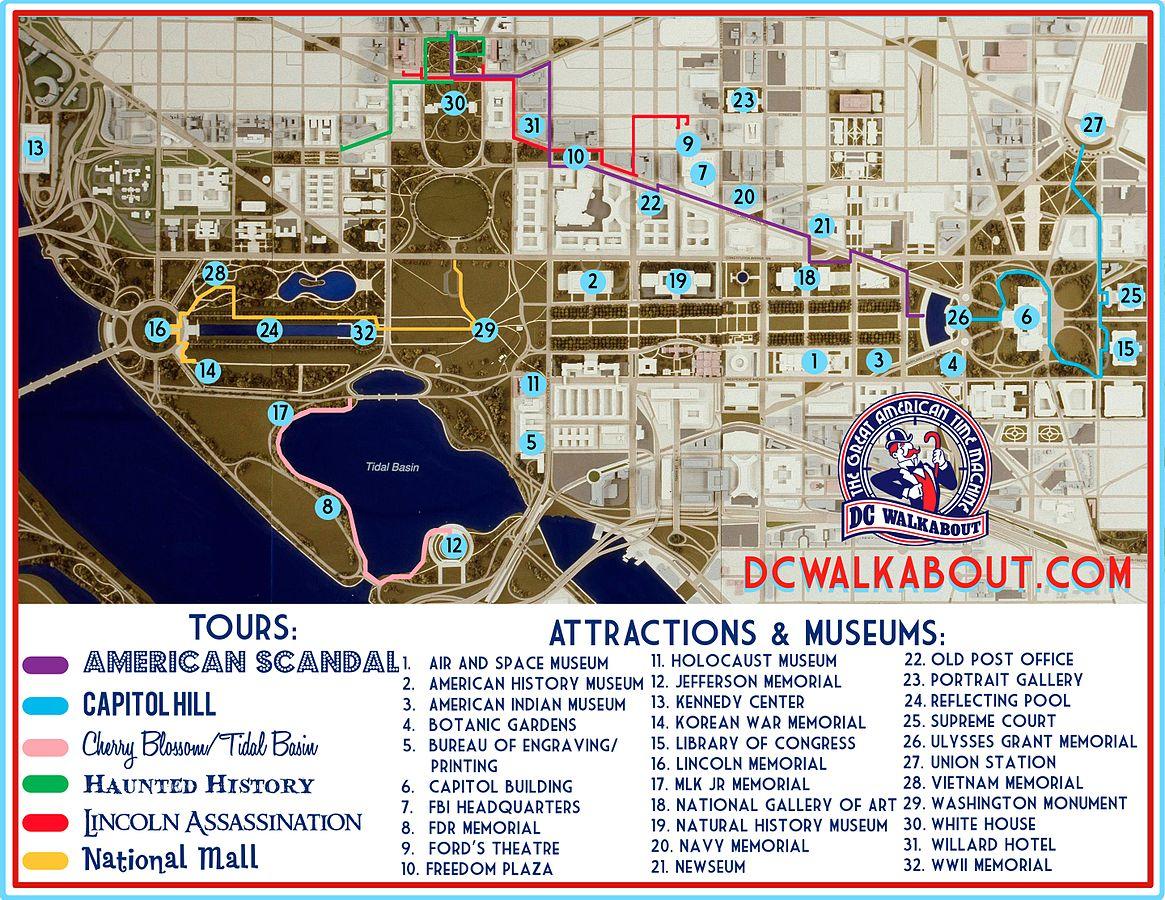
Figure 8.2: WHAT….is there interestng to see in Washington? (Source: Wikimedia Commons, By Sancholibre - Own work, CC BY-SA 3.0, https://commons.wikimedia.org/w/index.php?curid=30991092)
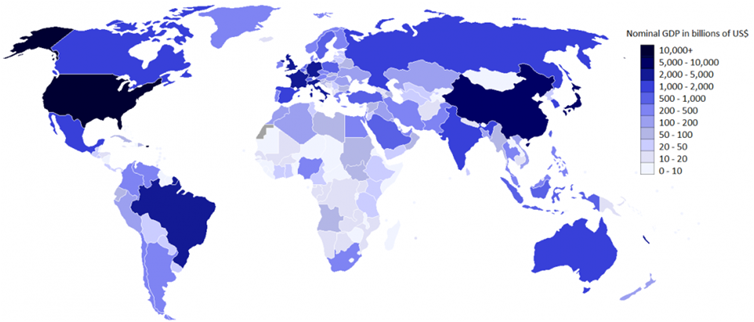
Figure 8.3: HOW MUCH…. nominal GDP does each country have? Map of nominal GDP by country (in USD) (Source: Wikimedia https://commons.wikimedia.org/wiki/).
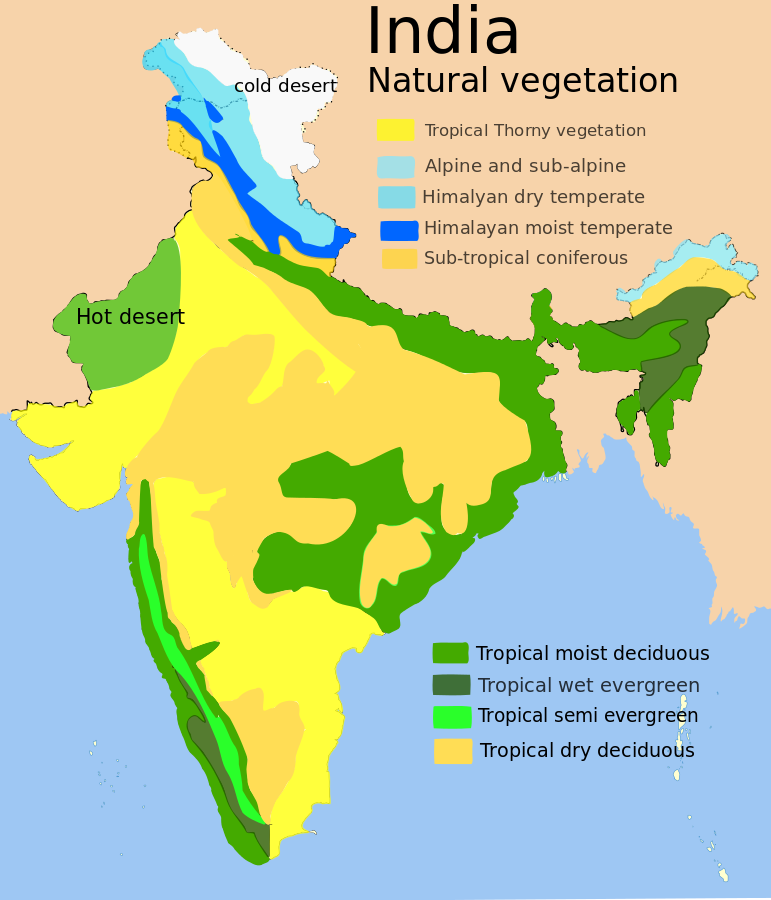
Figure 8.4: WHICH…. vegetation exists in India? Vegetation map of India. (Source: Wikimedia Commons, Author: Amog, https://commons.wikimedia.org/wiki/).
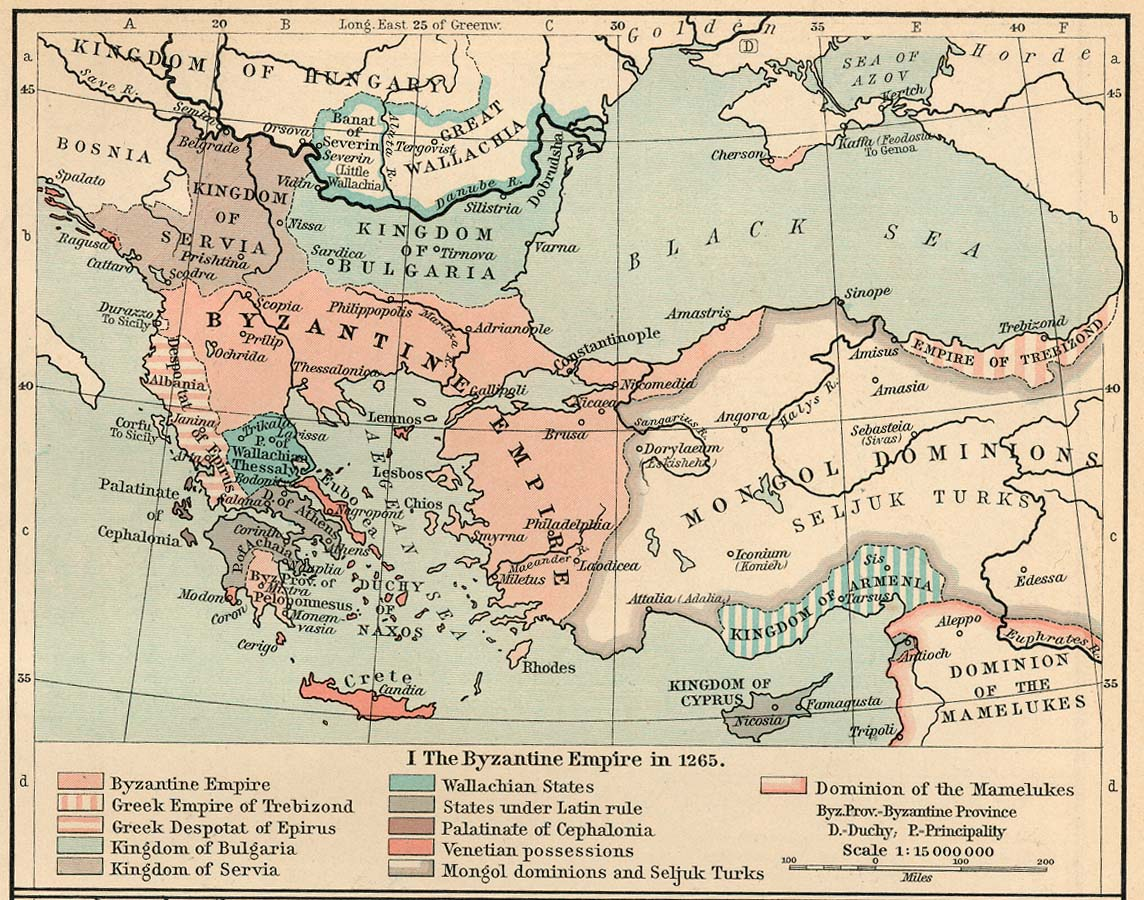
Figure 8.5: WHEN…. did the Kingdom of Cyprus exist? Shepherd, William. Historical Atlas. New York: Henry Holt and Company, 1911. Courtesy of the University of Texas Libraries, The University of Texas at Austin.
8.2 What is cartography?
Cartography is the art and science of making maps. Cartography includes the process of map production based upon the philosophical and theoretical foundations of mapmaking. A cartographer is someone who designs maps and prepares them for distribution. In other words, a cartographer is someone studying the philosophical and theoretical foundations of mapmaking. In earlier times, it was considered that only cartographers whose training lasted several years possess the skills and knowledge to produce maps. Today, however, cartography has been significantly democratized and many different groups can produce maps without engaging professional cartographers.
Cartography is a rarely self-sufficient profession. Today, it is considered to be the set of skills and knowledge necessary for geographers, geoinformaticians, and all others who want to produce maps.
“Map making is perhaps the oldest variety of primitive art . . . as old as man’s first tracings on the walls of caves and in the sands”, .
The oldest existing map was found at the archaeological site of Catalhoyuk in Anadolia, dating back to 6200 BC. This map (Figure 8.6), painted on a house wall, shows the city and a volcanic eruption in the background.
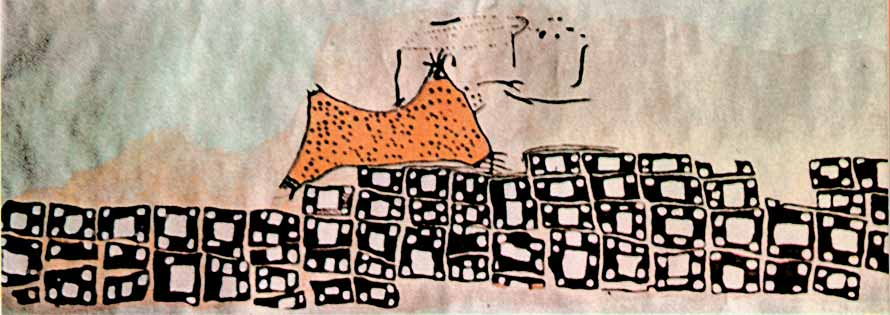
Figure 8.6: Catalhoyuk map.
The development of mathematics and geography in Greece and Rome led to the development of cartography. Original maps from this period are mostly lost, but their medieval transcripts and reconstructions are preserved, such as the reconstruction of Ptolemy’s world map, produced by Byzantine monks in Constantinople around 1300 (Figure 8.7, Ptolemy’s world map).
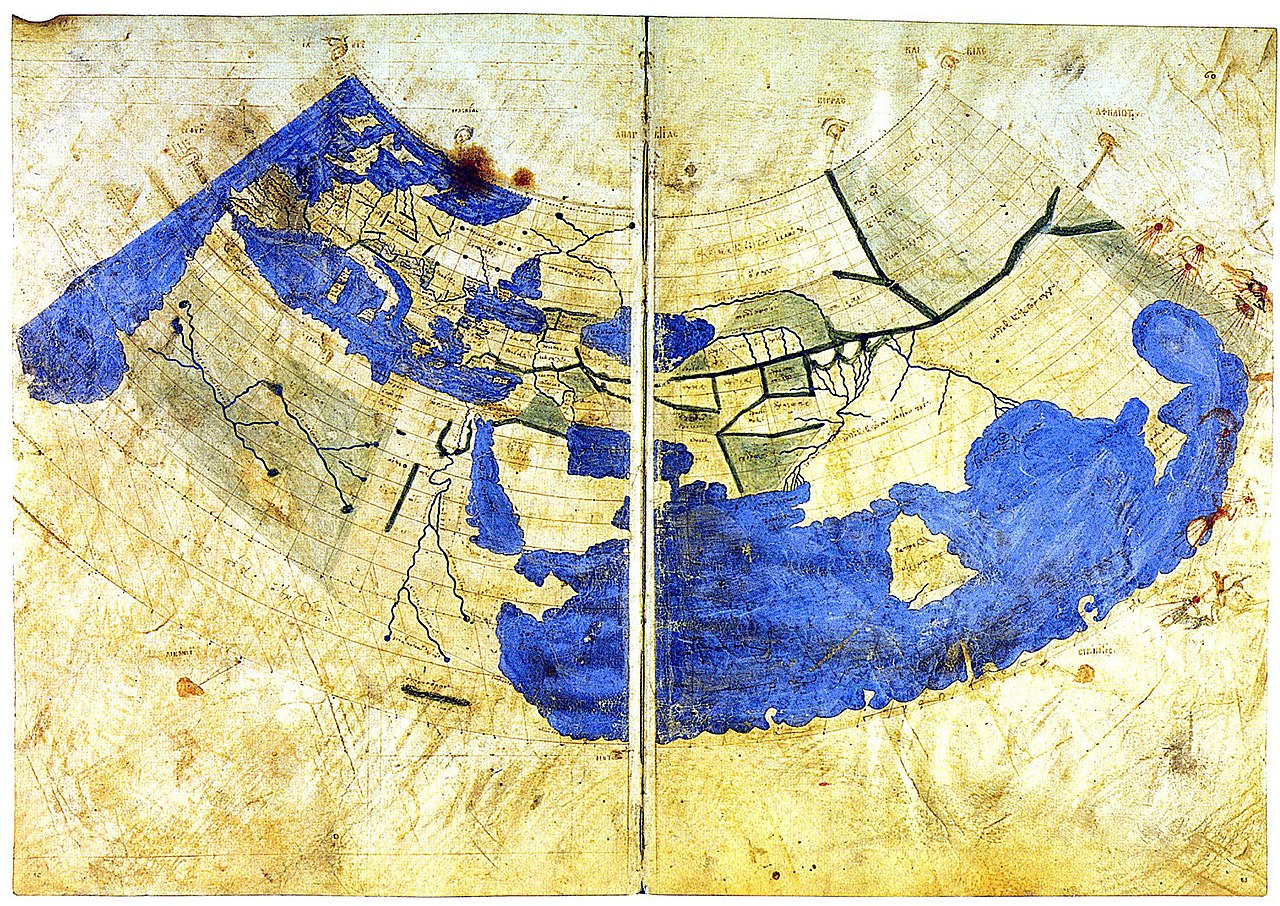
Figure 8.7: Oldest preserved Ptolemy’s world map (circa 1300).
During medieval times, European cartography was within the ideological framework of Christianity. Very popular maps during this period were so-called “T and O” maps (Figure 8.8). They showed Jerusalem in the centre with East oriented towards the upper part of the map. The circle represented the world ocean, and it was inscribed with the letter T representing bodies of water encircling then-known continents: Europe, Asia, and Africa.
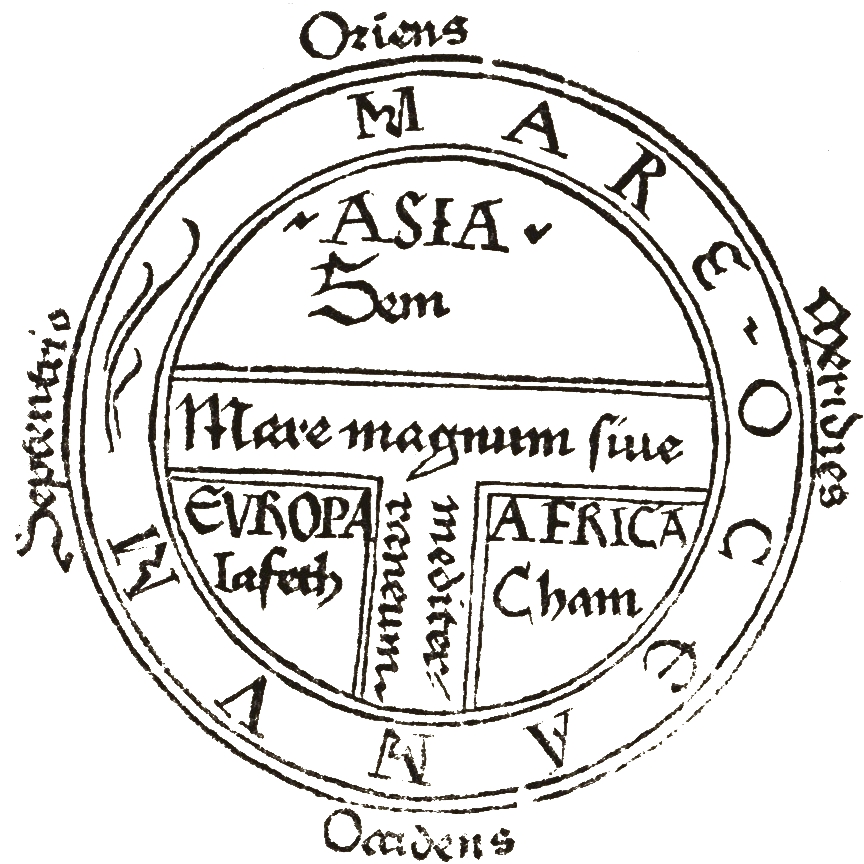
Figure 8.8: T and O map.
The Renaissance brought about two changes that significantly affected the development of cartography. The first was the invention of the printing press in the beginning of the XV century, which made maps much more available. The second was the restoration of scientific knowledge from antiquity and the imrovement of multiple scientific disciplines, of which geography, mathematics, and astronomy were of major importance for cartography. One of the most important cartographers of this period was Sebastian Münster from Basel, who published a world atlas in 1540 under the title Geographia (Figure 8.9) and set a global standard for world maps.
Figure 8.9: Geographia - Sebastian Münster.
A visible advance in cartography was the results of the Age of Discovery in the XV and XVI centuries: the Americas and the naval route to India were discovered and the colonization of other continents began. Maps were produced to facilitate naval navigation; hence, the focus was on mapping coastal lines, islands, rivers, ports, and phenomena of interest to navigation. The production of globes was started as well as the development of new cartographic projections. The latter was possible thanks to another great Renaissance cartographer, the Flemish Gerardus Mercator. He developed the cylindrical conformal projection for the world map which significantly facilitated navigation, Figure 8.10 (Source: http://academic.emporia.edu/aberjame/map/h_map/h_map.htm). This projection is still today popular for global maps.
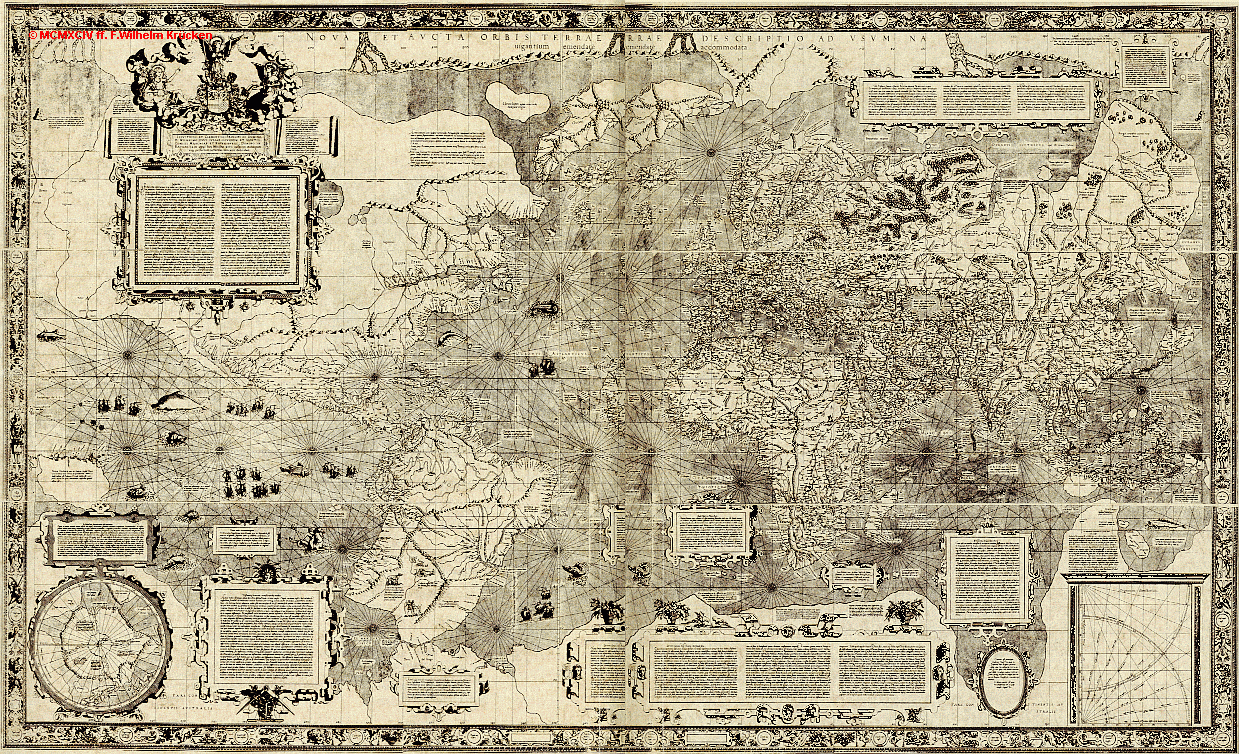
Figure 8.10: The Mercator world map from 1569.
The Age of Enlightenment which began in the second half of the XVII century, set reason as the primary source of authority. Societies began intensely to base their functioning on scientific knowledge and methods, and not religious dogma. In this spirit, maps acquired the role of primary sources of knowledge tranfer. It is especially important that governments and administrative institutions began to increasingly rely on maps to regulate and control their territories4. One of the most significant moments in the history of cartography was the beginning of the production of the topographic map of France in the 1670s, at the request of King Louis XIV and led by Giovanni Domenico Cassini and his heirs. These were the first maps whose production was based on geodetic triangulation, Figure 8.11. It can be said that, just as the Englightenment is considered the beginning of the modern era in human history, it is also the beginning of modern cartography.
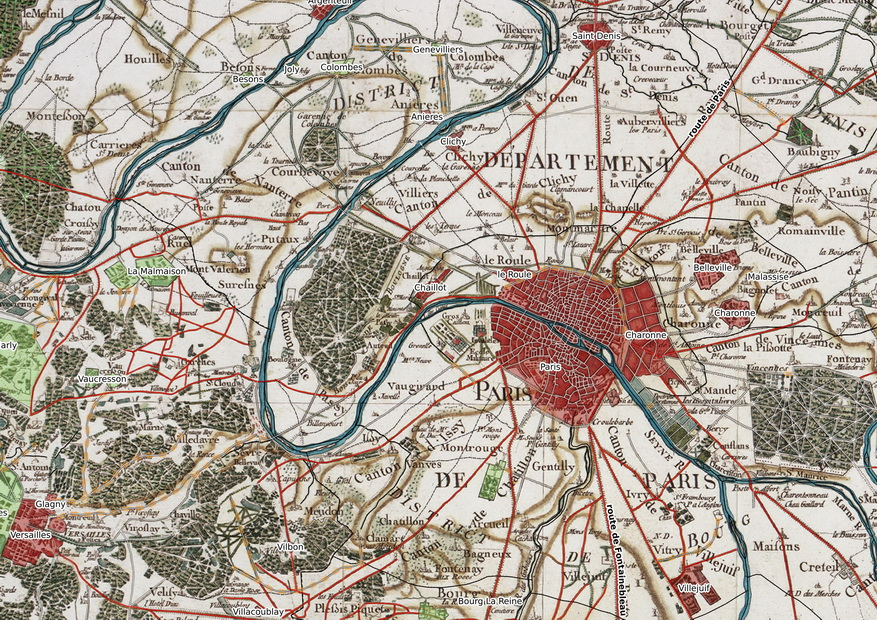
Figure 8.11: A detail of Cassini’s topographic map of France (XVII–XVIII century).
8.3 Map classification5
Maps can be classified according to the medium they used for presenting information to users and according to type of information being presented.
When referring to media used by maps to present information to users, in cartography, there are three types: tangible, virtual, and mental.
A tangible map is that which can be held physically, e.g., a paper map. The good thing about these maps is that they can be shared between users easily and there is no need for specialized software to use them. Also, tangible maps are portable and can last a very long time without maintenance.
A virtual map is any map displayed on an electronic device. Today, maps can be found on desktop computers, laptops, tablets, mobile phones, GPS receivers, and various other digital devices. The advantages of virtual maps is that they can be updated easily, they are dynamic, they can be animated and connected to large amounts of information such as documents, images, video and sound, and they can be shared easily. The negative aspects of virtual maps are the following: they require a certain hardware and software in order to view them, they need to be maintained, they can be unintuitive for some users, and more knowledge is required in order to produce them.
A mental map is a map in someone’s mind and their specific conceptualization of space. Mental maps are transmitted through conversion into tangible or virtual maps, but also through other means of communication such as speech and writing.
Tangible and virtual maps can be gerenal reference maps or thematic maps.
General reference maps emphasize locations and display a large number of phenomena. They primarily represent objects, their location, and information identifying those objects. General reference maps are not specialized for any special use, but are intended for a wide spectrum of activities. Examples of general reference maps are topographic maps and global web maps (e.g., Google Maps and OpenStreetMap).
Thematic maps emphasize characteristics related to specific themes. They typically have a very specific use and transmit a specific message about a theme generally connected to an attribute. Thematic maps show spatial and temporal patterns of a certain theme. Unlike general reference maps, thematic maps are usually very selective when it comes to objects and phenomena displayed on the map. Thematic maps can be qualitative and quantitative. Qualitative thematic maps show the qualitative aspects of a phenomenon or phenomena in the map’s focus, whereas quantitative the thematic maps show absolute and relative quantitative information concerning the phenomena of interest.
http://spatialquerylab.com/foss4g-academy-curriculum/gst-104-cartographic-design/↩
http://spatialquerylab.com/foss4g-academy-curriculum/gst-104-cartographic-design/↩
http://megf.org/2015/presentation/17%20Feb/GRASF%20Plenary/Georg%20Gartner.pdf↩
The History of Cartography Project, https://geography.wisc.edu/histcart/volume-4-cartography-in-the-european-enlightenment/↩
Parts of this section are adapted according to http://spatialquerylab.com/foss4g-academy-curriculum/gst-104-cartographic-design/ under license https://creativecommons.org/licenses/by/3.0/↩