1 Cartographic sources and spatial data
In digital cartography, data are available from different sources. Data often exist in standard GIS formats and with the possibility of direct download from the Internet. Data can also be generated from land and photogrammetric surveys, laser scanning, remote sensing, or using GIS techniques and tabular data, e.g., census data by municipality and spatial data representing municipality administrative borders can be merged in order to obtain spatial census data. Digital cartographic data can also be obtained by digitalization of existing maps, including scanned plans and maps, or through the process of cartographic generalization. Seemingly non-spatial data can be potential cartographic sources as well. Data on the number of students in Belgrade schools can become spatial data if an address is available for each school; based on addresses, coordinates can be obtained through the process of geocoding.
Cartographic sources can be illustrated as shown in Figure 1.1:
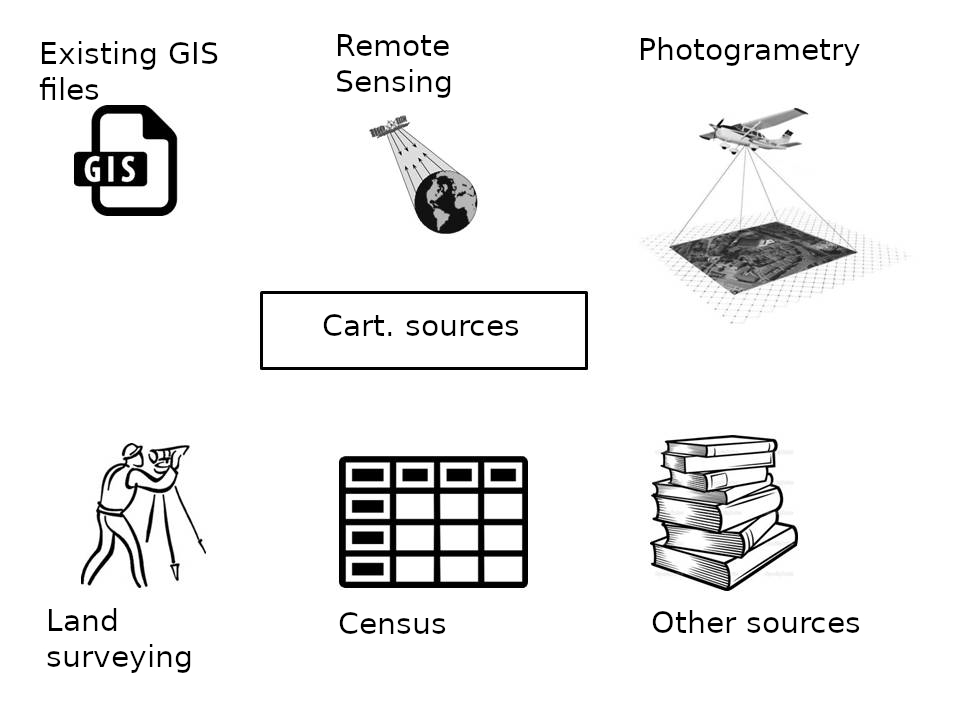
Figure 1.1: Cartographic sources, methods of collecting spatial data.
All above-mentioned techniques for collecting spatial data are carried out in order to describe a section of the real world (or some natural spatial phenomenon) with spatial data that mostly contain information on the location in space (most often in the form of coordinates), connected with certain attributes. An attribute can be obtained directly from a sensor or can be connected to the data by the person collecting the data. For example, information on the location of a meteorological station is usually connected with information on times and values of climatic measurements on that station. This is a case of so-called spatio-temporal data, in which the time of observing a phenomenon is recorded alongside the spatial information. In a general case, in order to model geographic reality, high-quality spatio-temporal data is needed.
In the example of the meteorological station, the sensor measurements are usually in the form of numerical data such as temperature or rainfall. However, in this same case, categorical data are also often collected such as whether the air is misty or not, or whether the sky is clear or cloudy. Hence, spatial phenomena are generally described by two types of data: quantitative (numerical) and qualitative (descriptive). If descriptive data are sorted into classes or categories (e.g., weather can be described by three classes: clear, moderately cloudy, and completely cloudy), then these are categorical or categorical or factorial data..
Data which are related to a discrete number of spatial observations are called vector data. Vector data have the property of describing a phenomenon whose spatial distribution is abstracted by a point, line, or polygon in space. If we observe the network of meteorological stations, it represents a vector layer of data in which every station represent one entity in the layer, Figure 1.2 in a Robinson projection.
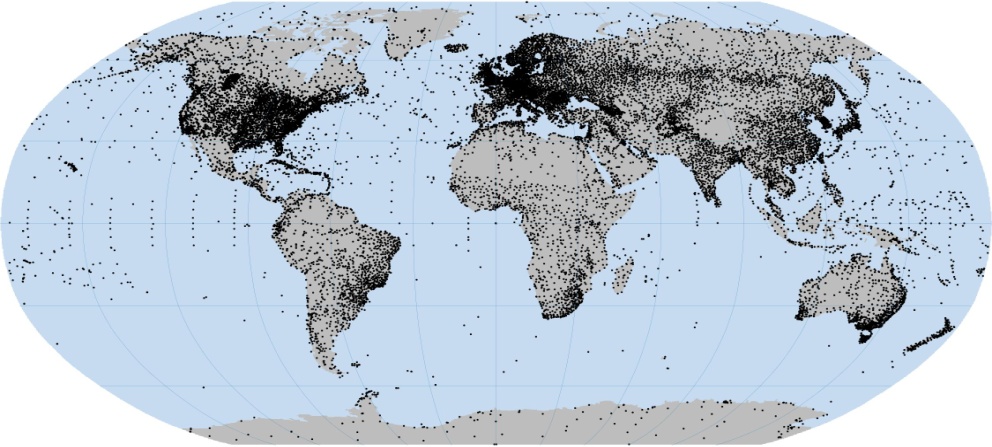
Figure 1.2: Vector set of data with the locations of all stations in the international Global Surface Summary of the Day (GSOD) meteorological network, in a Robinson projection.
Based on the above presented temperature dataset, we can extract information on temperature at every meteorological station’s location, but the temperature at locations without measurements remains unknown. If a temperature field is considered, i.e. the set of all temperatures at a given moment for each location, a regular grid or raster structure can be used for its representation. Continuous data on the temperature values in a regular 1x1 km grid are shown in Figure 1.3. Such a regular grid represents raster data, which will be explained in detail later.
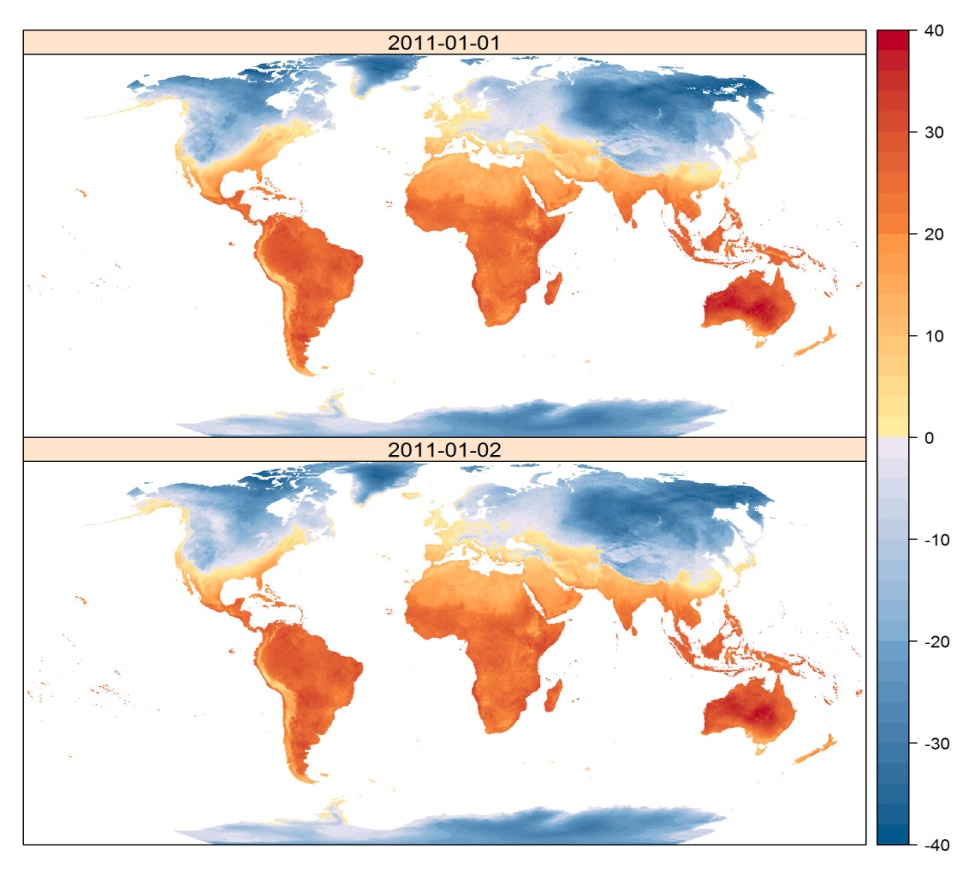
Figure 1.3: Raster dataset on temperature prediction in a regular grip for January 1–2, 2011.
A raster or grid is a spatial data structure dividing space into rectangular cells (pixels) containing one or more values of an observed or modeled phenomenon. The analogy with attributes of vector data is clear, cell values are usually numerical or categorical data. Often, raster data is obtained based on photogrammetric surveys or as a result of remote sensing, i.e., they are optical or radar measurements, land surface temperature measurements, etc.
Vector as object and Raster as field
“The traditional vector and raster perspective of our world is one that has been driven by software and data storage environments. An object view of the world treats entities as discrete objects; they need not occur at every location within a study area. Point locations of cities would be an example of an object. So would be polygonal representations of urban areas which may be non-contiguous. A field view of the world treats entities as a scalar field. This is a mathematical concept in which a scalar is a quantity having a magnitude. It is measurable at every location within the study region. Two popular examples of a scalar field are surface elevation and surface temperature. Each represents a property that can be measured at any location.”
— Manuel Gimond, https://mgimond.github.io/Spatial/index.html).