ADDRESS
-
Address: Bulevar kralja Aleksandra 73
11000 Belgrade, Serbia - Email: kili@grf.bg.ac.rs
- Website: osgl.grf.bg.ac.rs
- Toll Free: +381 11 3218-630
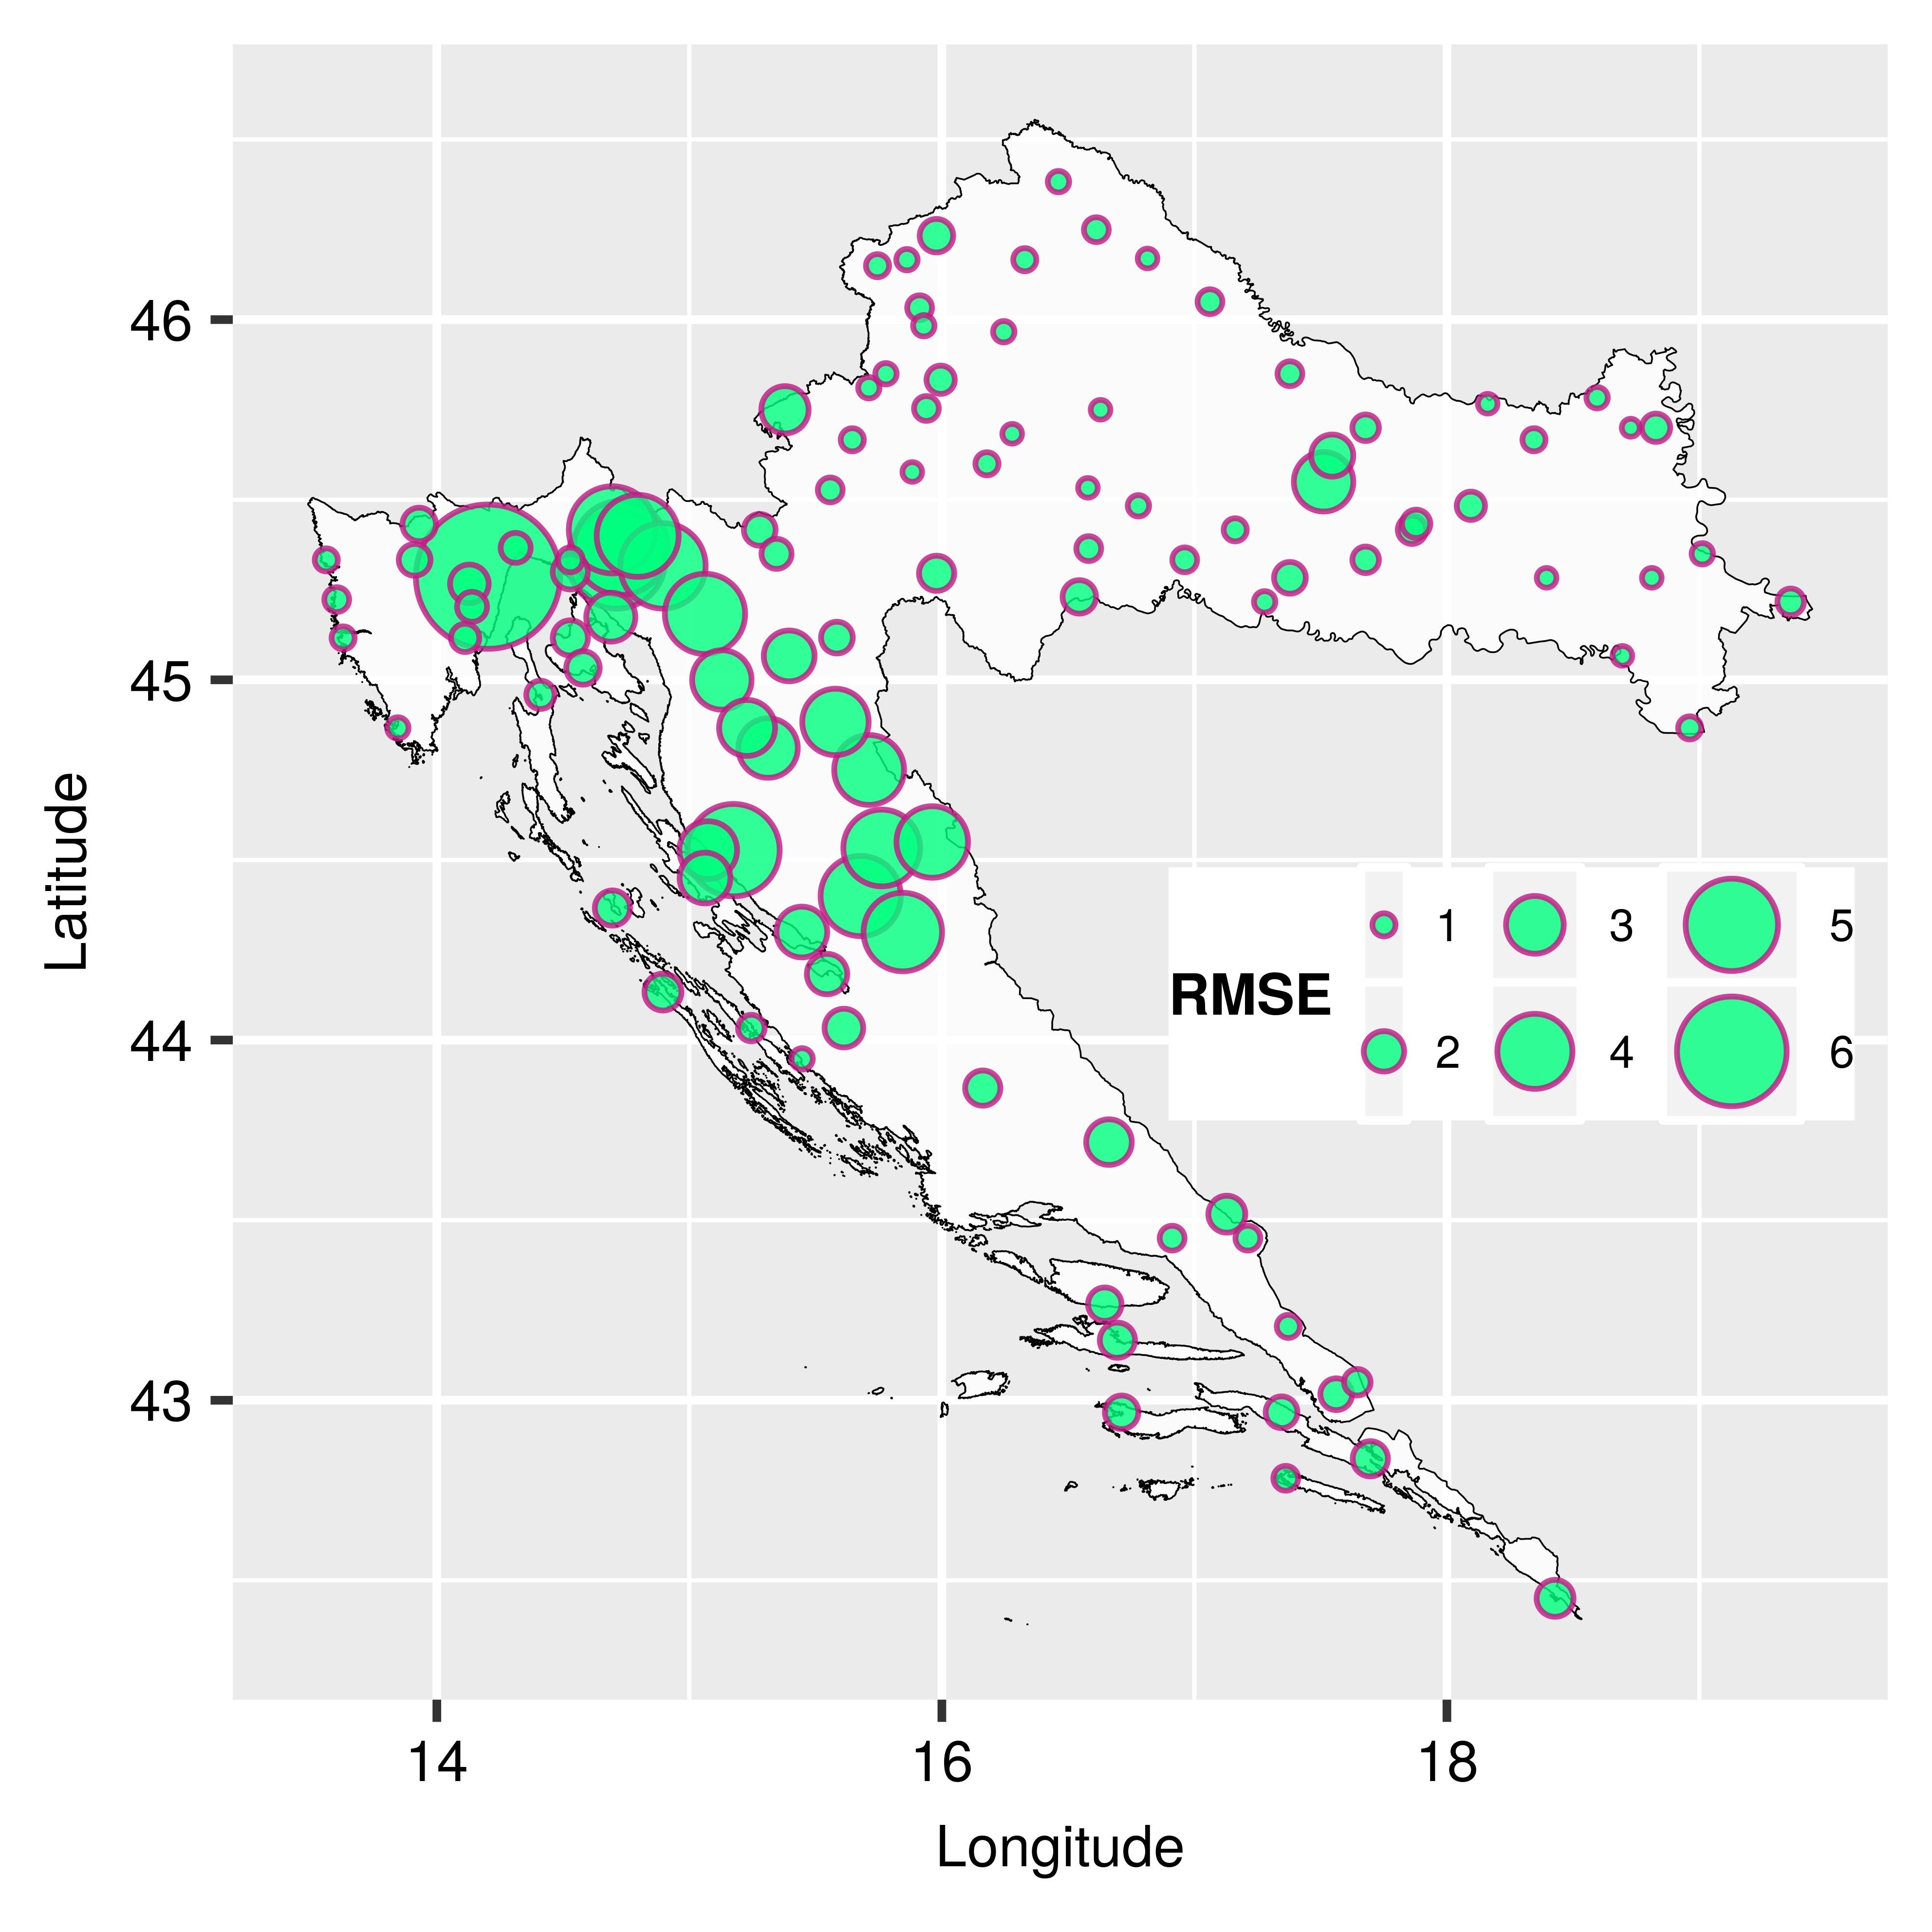
Annual average RMSE per station for testing of STRK_global predictions made by using GSOD stations (Fig. 5)
Click to switch to interactive map.

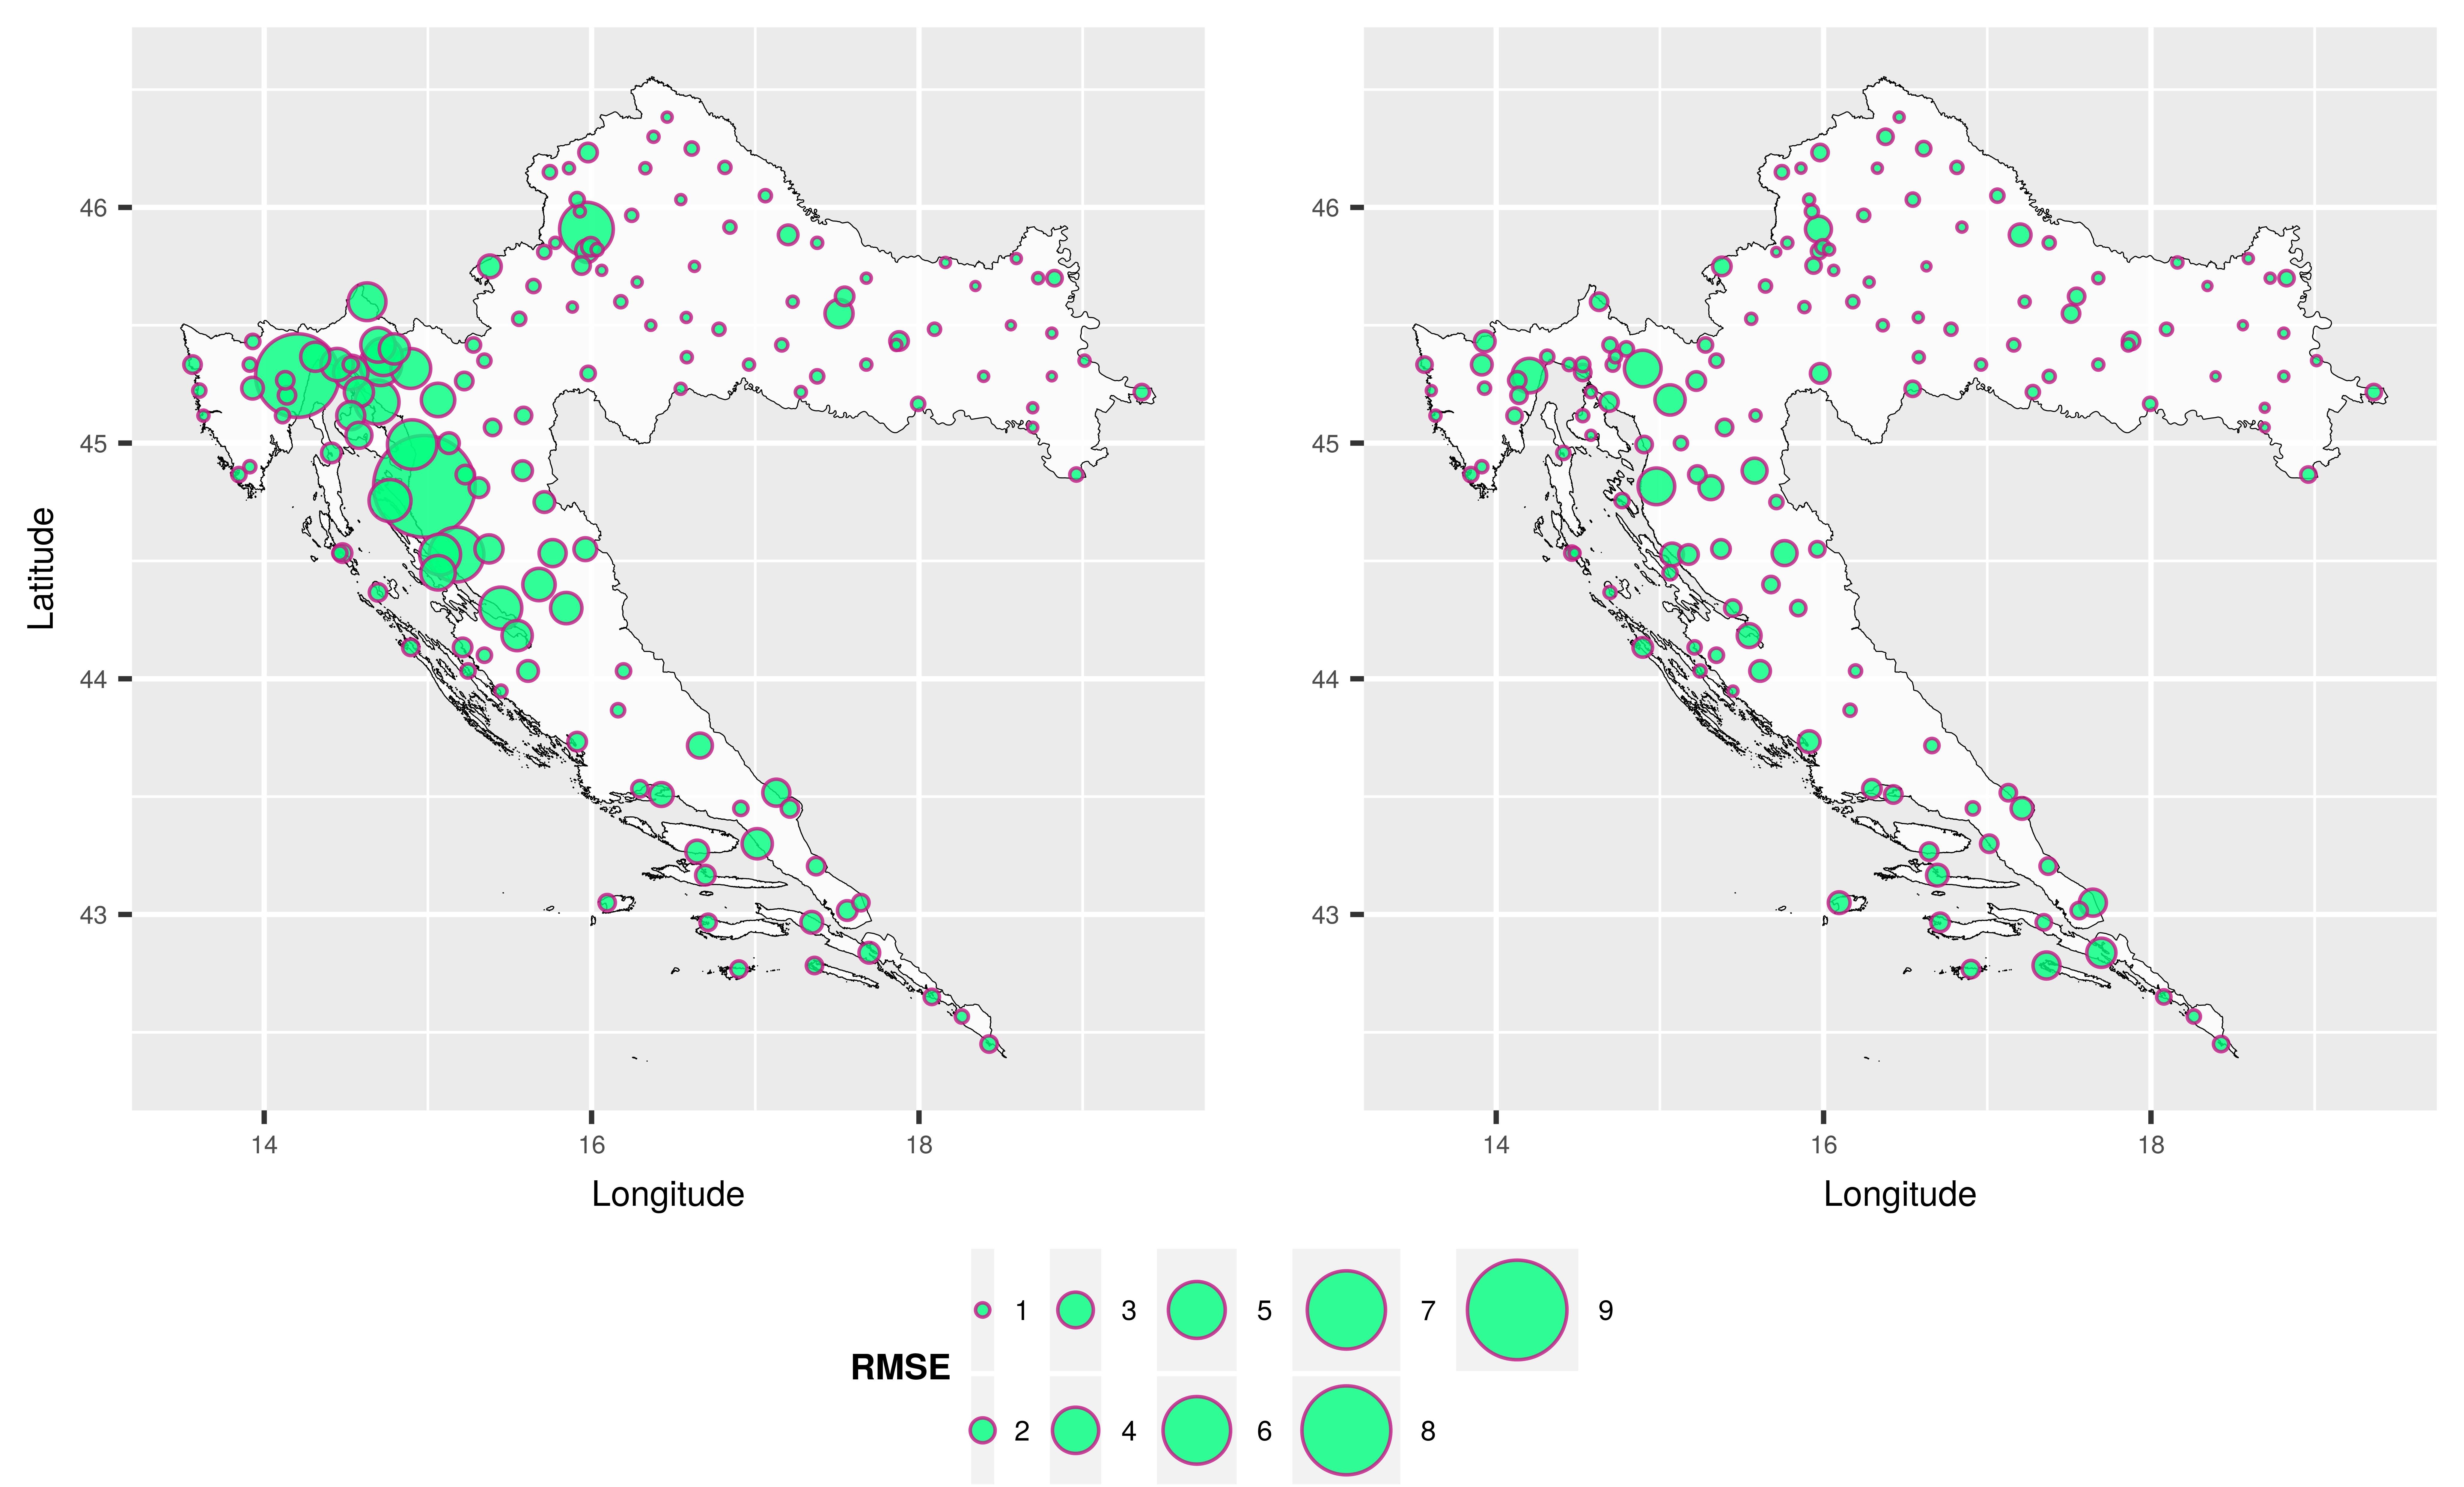
Annual average RMSE per station. Results of LOO cross-validation (Fig. 6)
STRK_global
STRK_Croatia

Annual average RMSE per station. Results of LOO cross-validation (Fig. 6)
STRK_global
STRK_Croatia
